Mixpanel-style Analytics For Customer Unit Economics
Learn how to build your own analytics and tracking tool.
Published on Dec 5, 2023 • 29 min read •
Happy New Year!🥳 Latest update starts here.
I didn’t write a lot of build articles this year so I’m attempting to finish off by writing one that’s a little complex. It could get pretty long so I’m going to be writing and releasing it in bits over the next two or three Mondays. I’m not very fond of frontend things so this is going to be a primarily API (first) build.
What we’re building
A few weeks ago I came across a tweet I found pretty interesting. It was about building a Mixpanel-style analytics for customer unit economics (That’s a mouth full. Lol). I love tools like Mixpanel and June because they tell you a lot about your business and you can track even the smallest things but also because I think they take visualizing data to another level.
In his tweet, Tom talks about an “event-driven data architecture” they have at Monzo which allows them “assign cost or revenue to every action a customer might take.” This basically means that they would look at each customers interaction and attribute figures to their actions so they could know how much a customer had made them or how much a customer had cost them.
Let’s use Zee, an imaginary savings firm that handles its transactions through Paystack. Each time a customer deposits funds to a fixed-term savings scheme using Paystack, Zee incurs a fee of 1.4% of the deposited sum. At the same time, they earn an interest ranging from 1 to 3% on the saved amount. In another scenario, if Zee allocates $79 monthly for their customer support tool and logs 200,000 minutes of support in a month, the cost to Zee per minute of customer support time amounts to $0.000395. Following so far?
It essentially just involves the standard method of computing costs, revenue, and ultimately profit and loss for a company. But in this case, the calculation is more granular, breaking it down to the level of each individual customer interaction.
The tool we’ll use to track, measure and calculate each of these interactions is what we are building. Of course you could probably tweak an existing tool to get these results on some level but as usual I just want to show you the extent of what you can create from scratch yourself if you choose to.
Toolstack
For this build, we’re going to use:
- Xano - I think Xano is an absolutely wonderful tool. I find that it’s majorly used as an external database to other no-code tools but you can also use Xano to build your own API products.
- Graphy - Helps you visualize and share data beautifully.
How it works
Our tool is going to work similarly to Mixpanel, capturing details of each interaction a customer has and then transmitting it to our API. The properties of these events that we capture are super important because they make the data pool that we’ll analyze and transform into simple visual representations.
Checklist
- Build the Ingestion API
- Structure the database
- Build out the endpoints
- Authenticating the API
- Build out the Analytics
Next up, we’ll start our build from the first step - developing the ingestion API.
Build the Ingestion API
There are two parts to building the Ingestion API, structuring our database and then developing the actual endpoints for the API. For this update we’ll be focusing on structuring our database. I’m also going to try as much as possible to show you around this side of Xano.
Intro to Xano Databases
Xano’s database works pretty much like any simple database you have come across. You can create multiple tables and in each table you can create columns for any number of field types and then you can add records on each row.
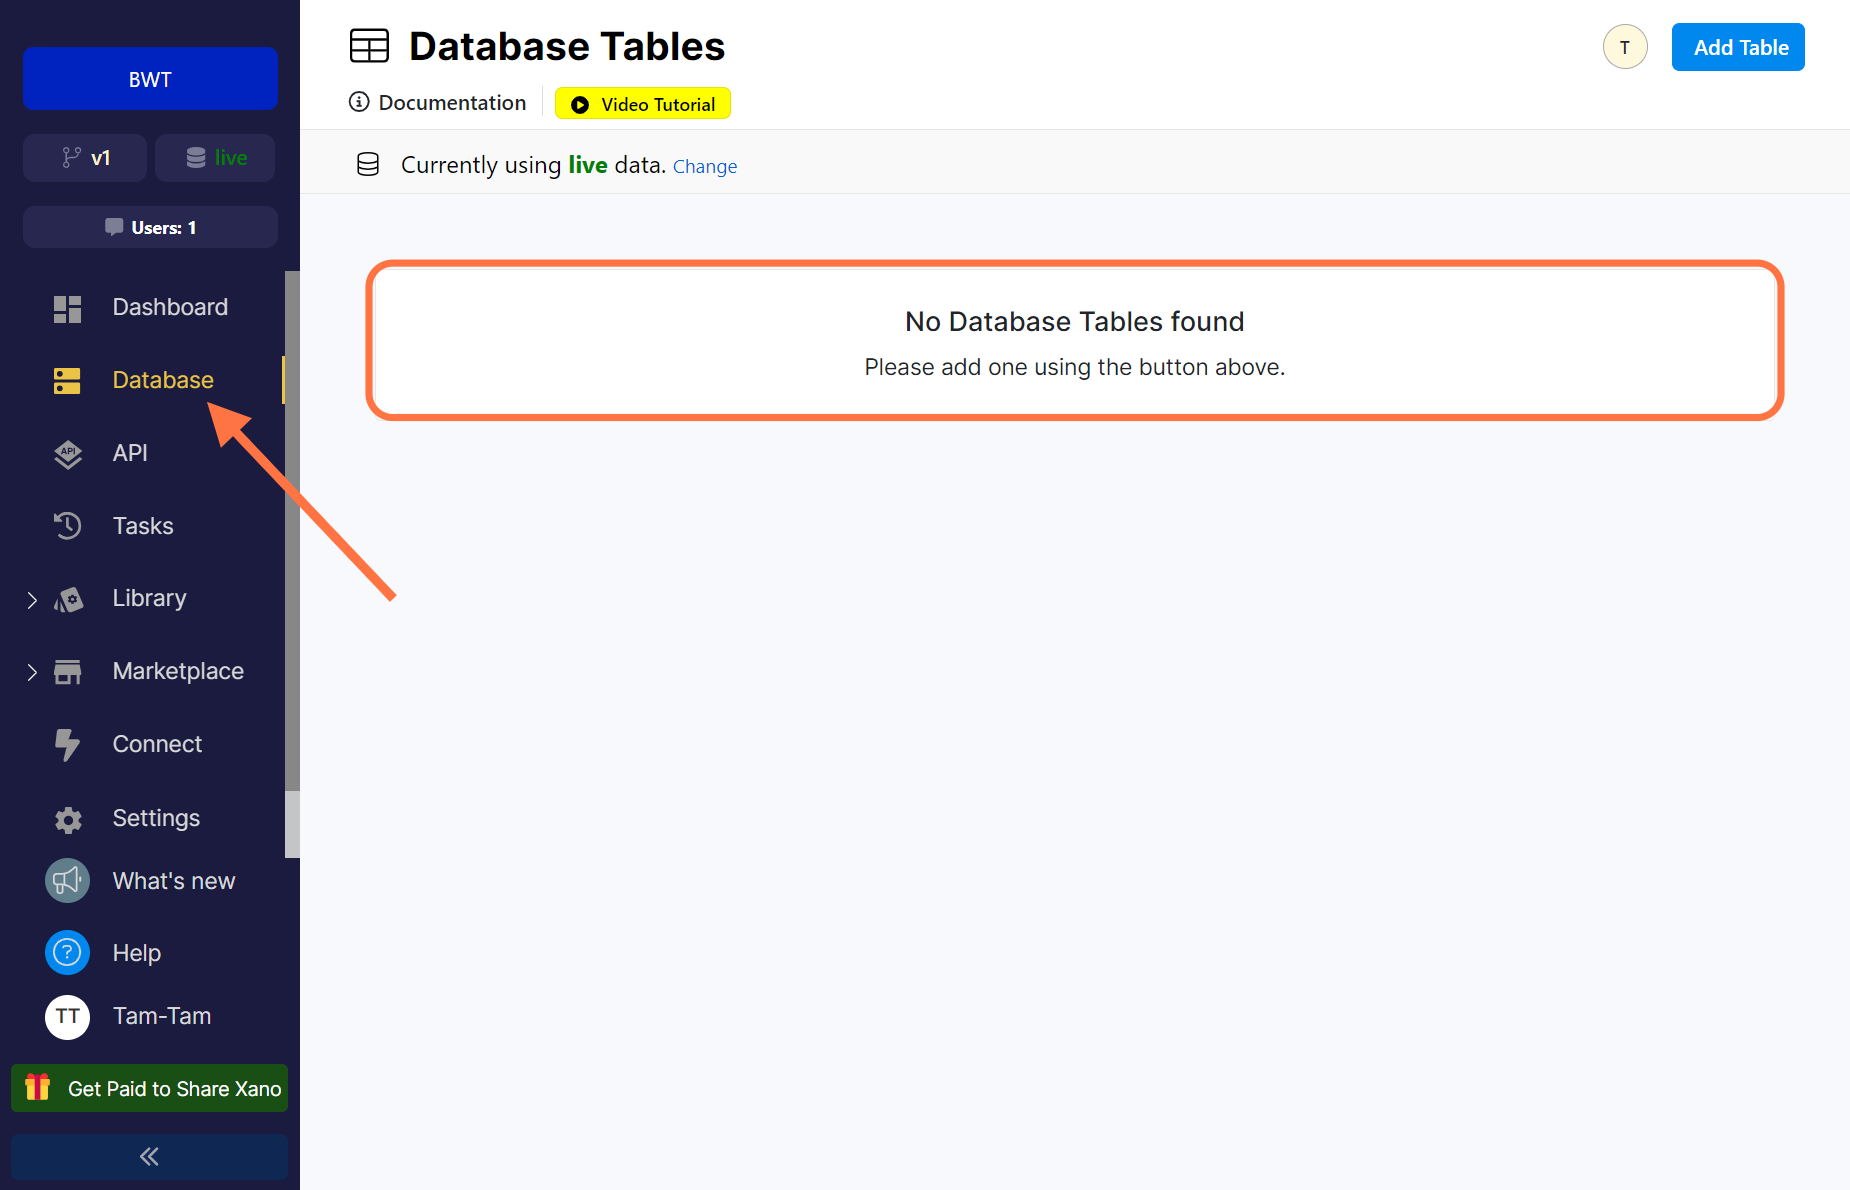
You can navigate to the Database page from the left side bar on Xano. The Dashboard page also helps give you an idea of how many tables you have in your database and how many records each table has. With the free plan, you get 100k records across your entire database.
Let’s create a simple table.
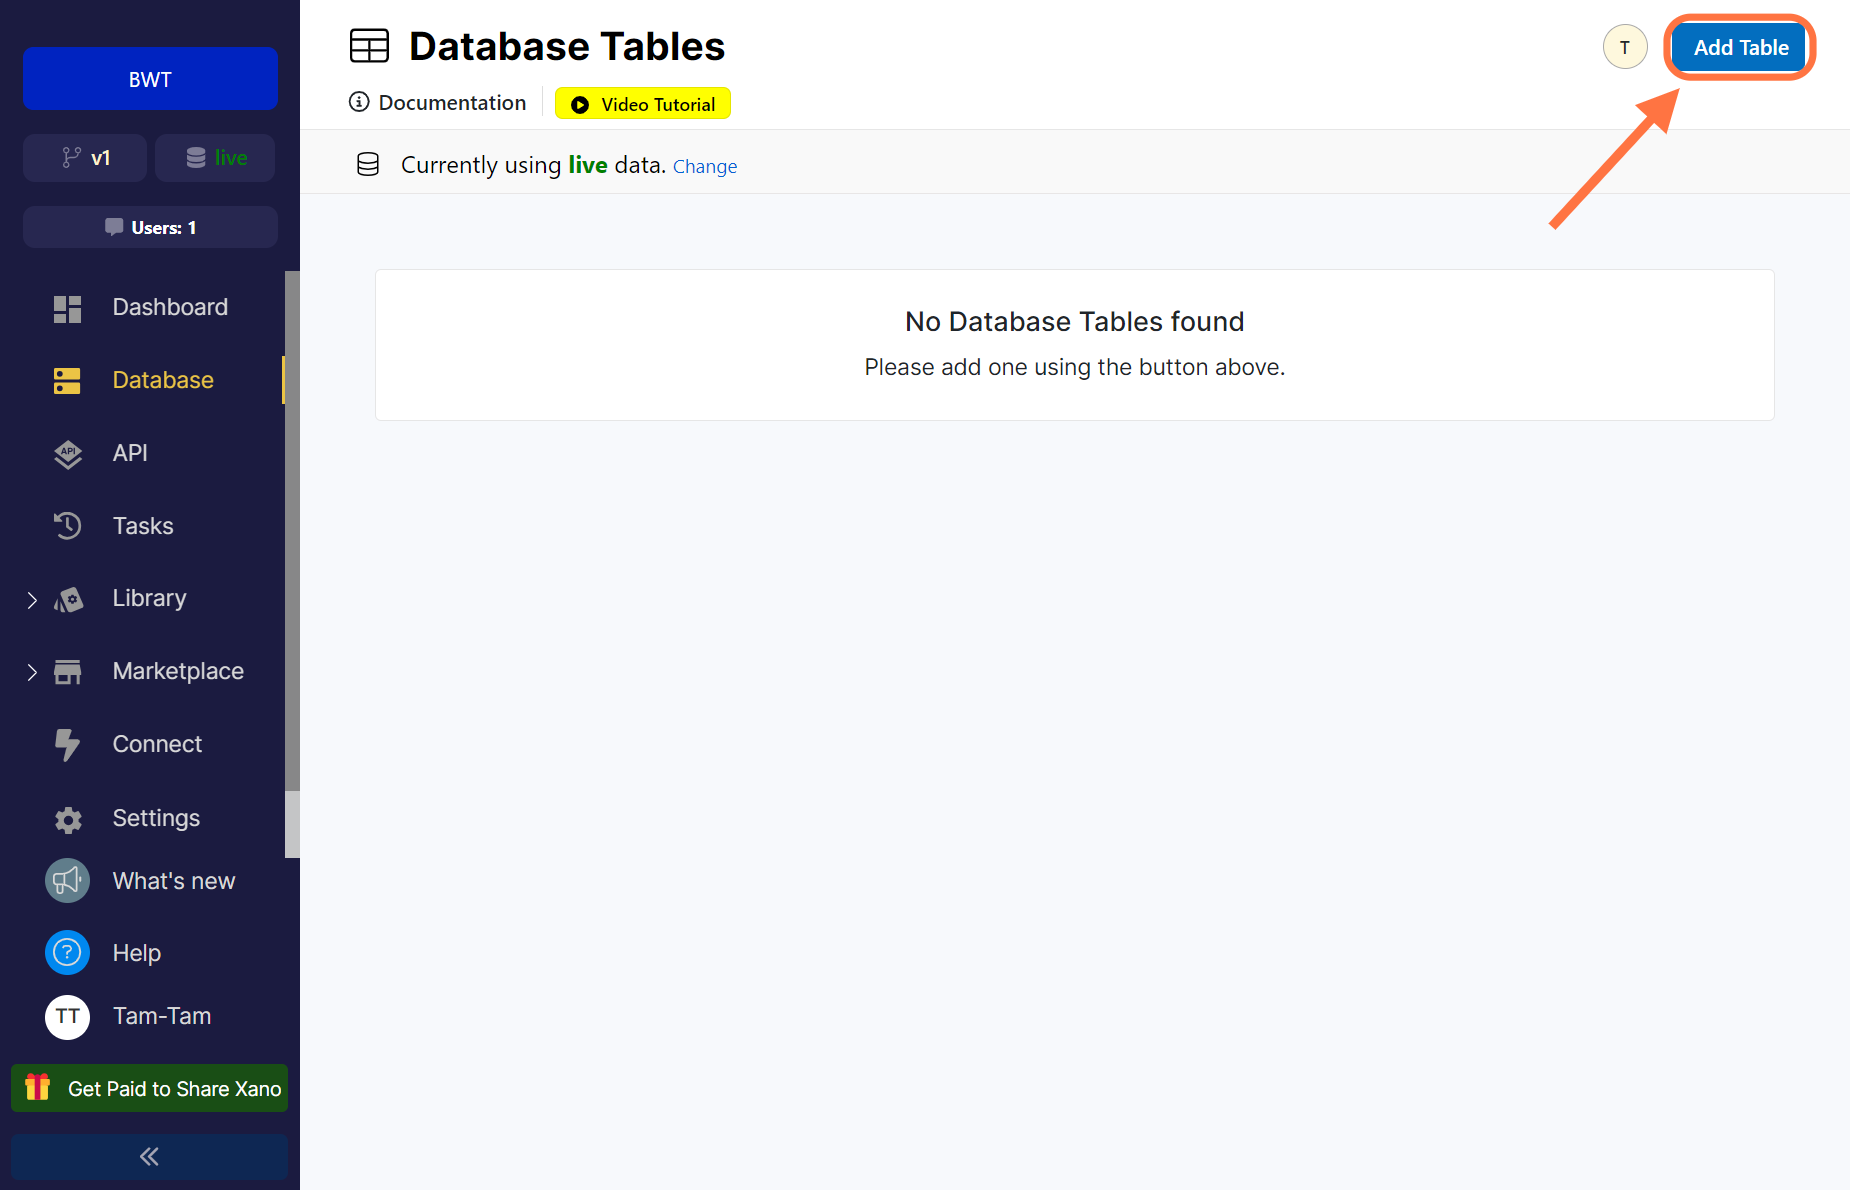
At the top right side, click on the Add Table button.
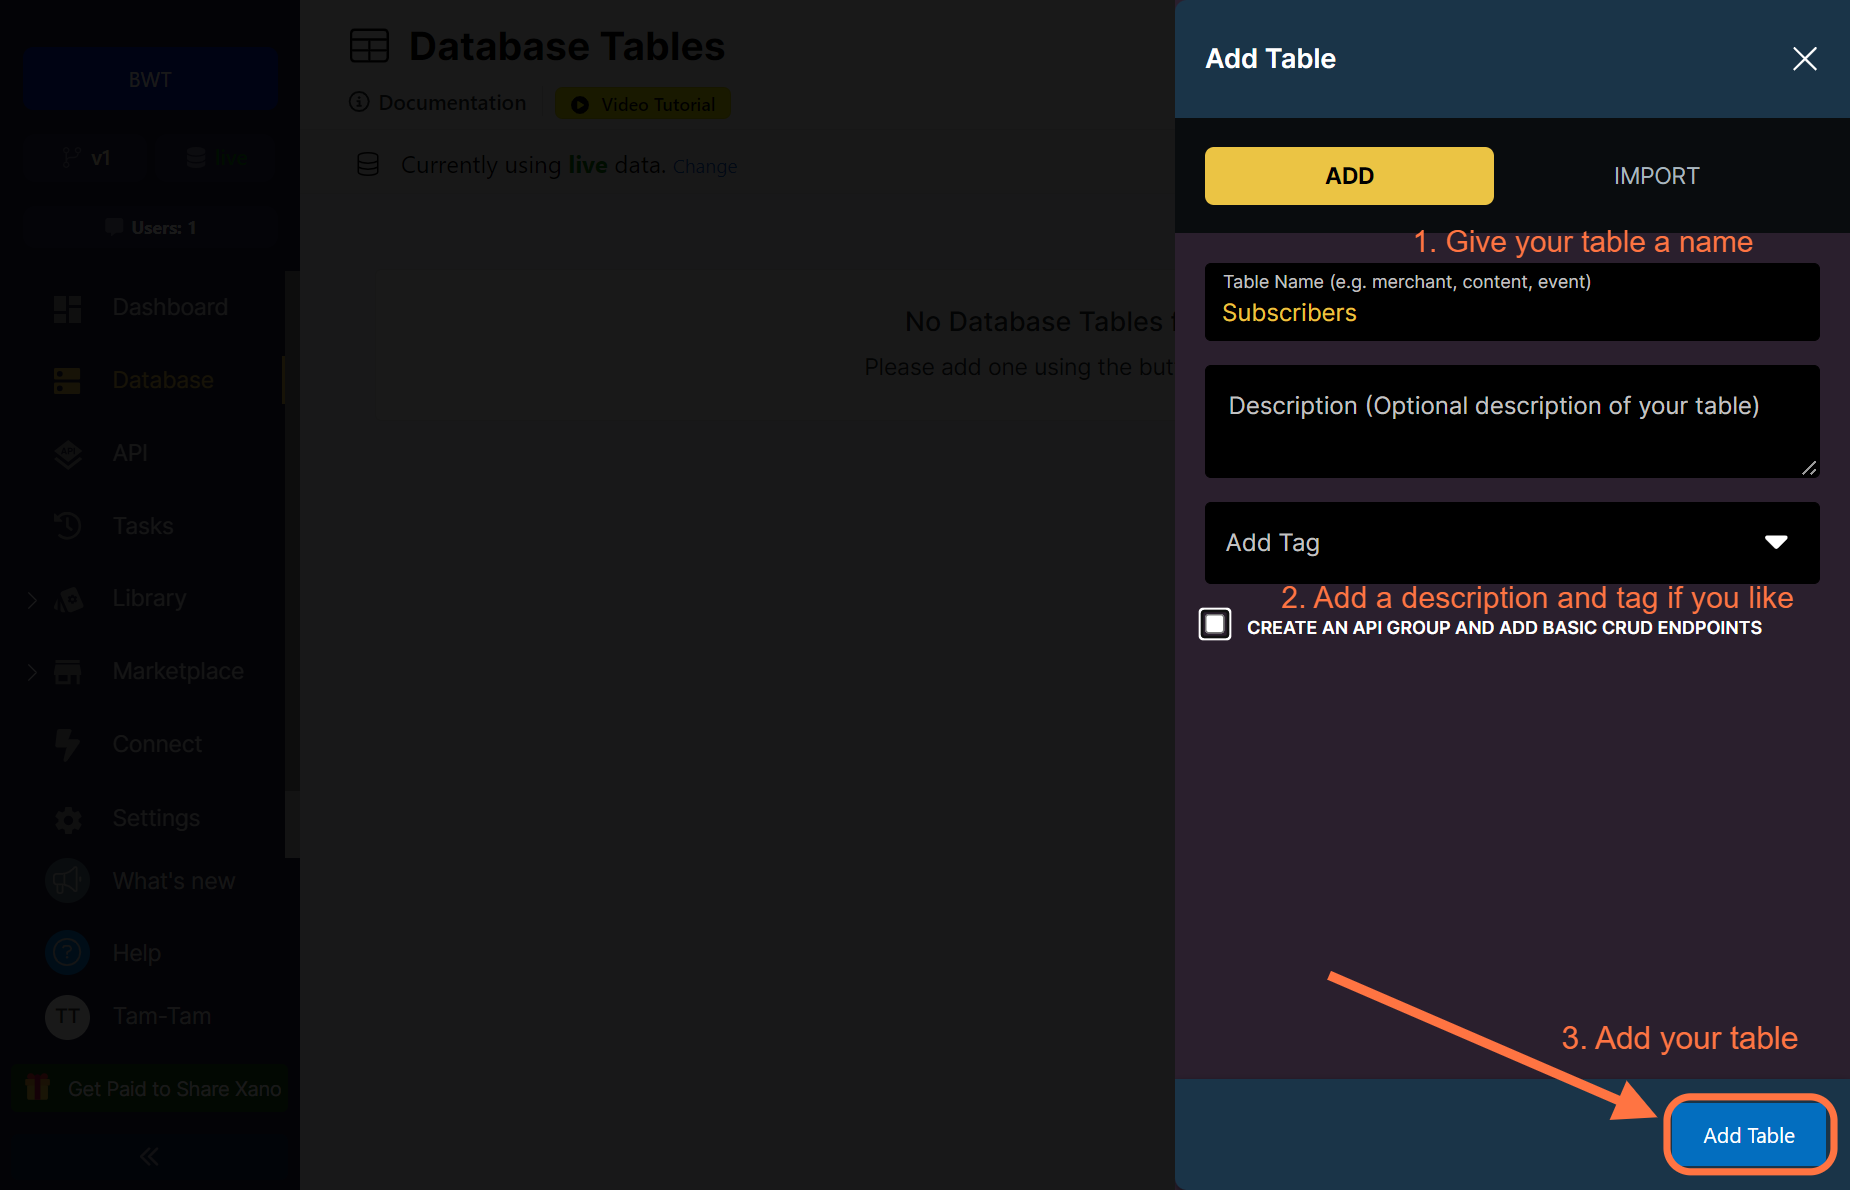
There are two ways to add a table to Xano. You can either import a csv or you can add the table manually. We’re working with the manual method. Give your table a name - in this case, Subscribers. Add a description and tag if you like and then click on the Add Table button on the lower right side.
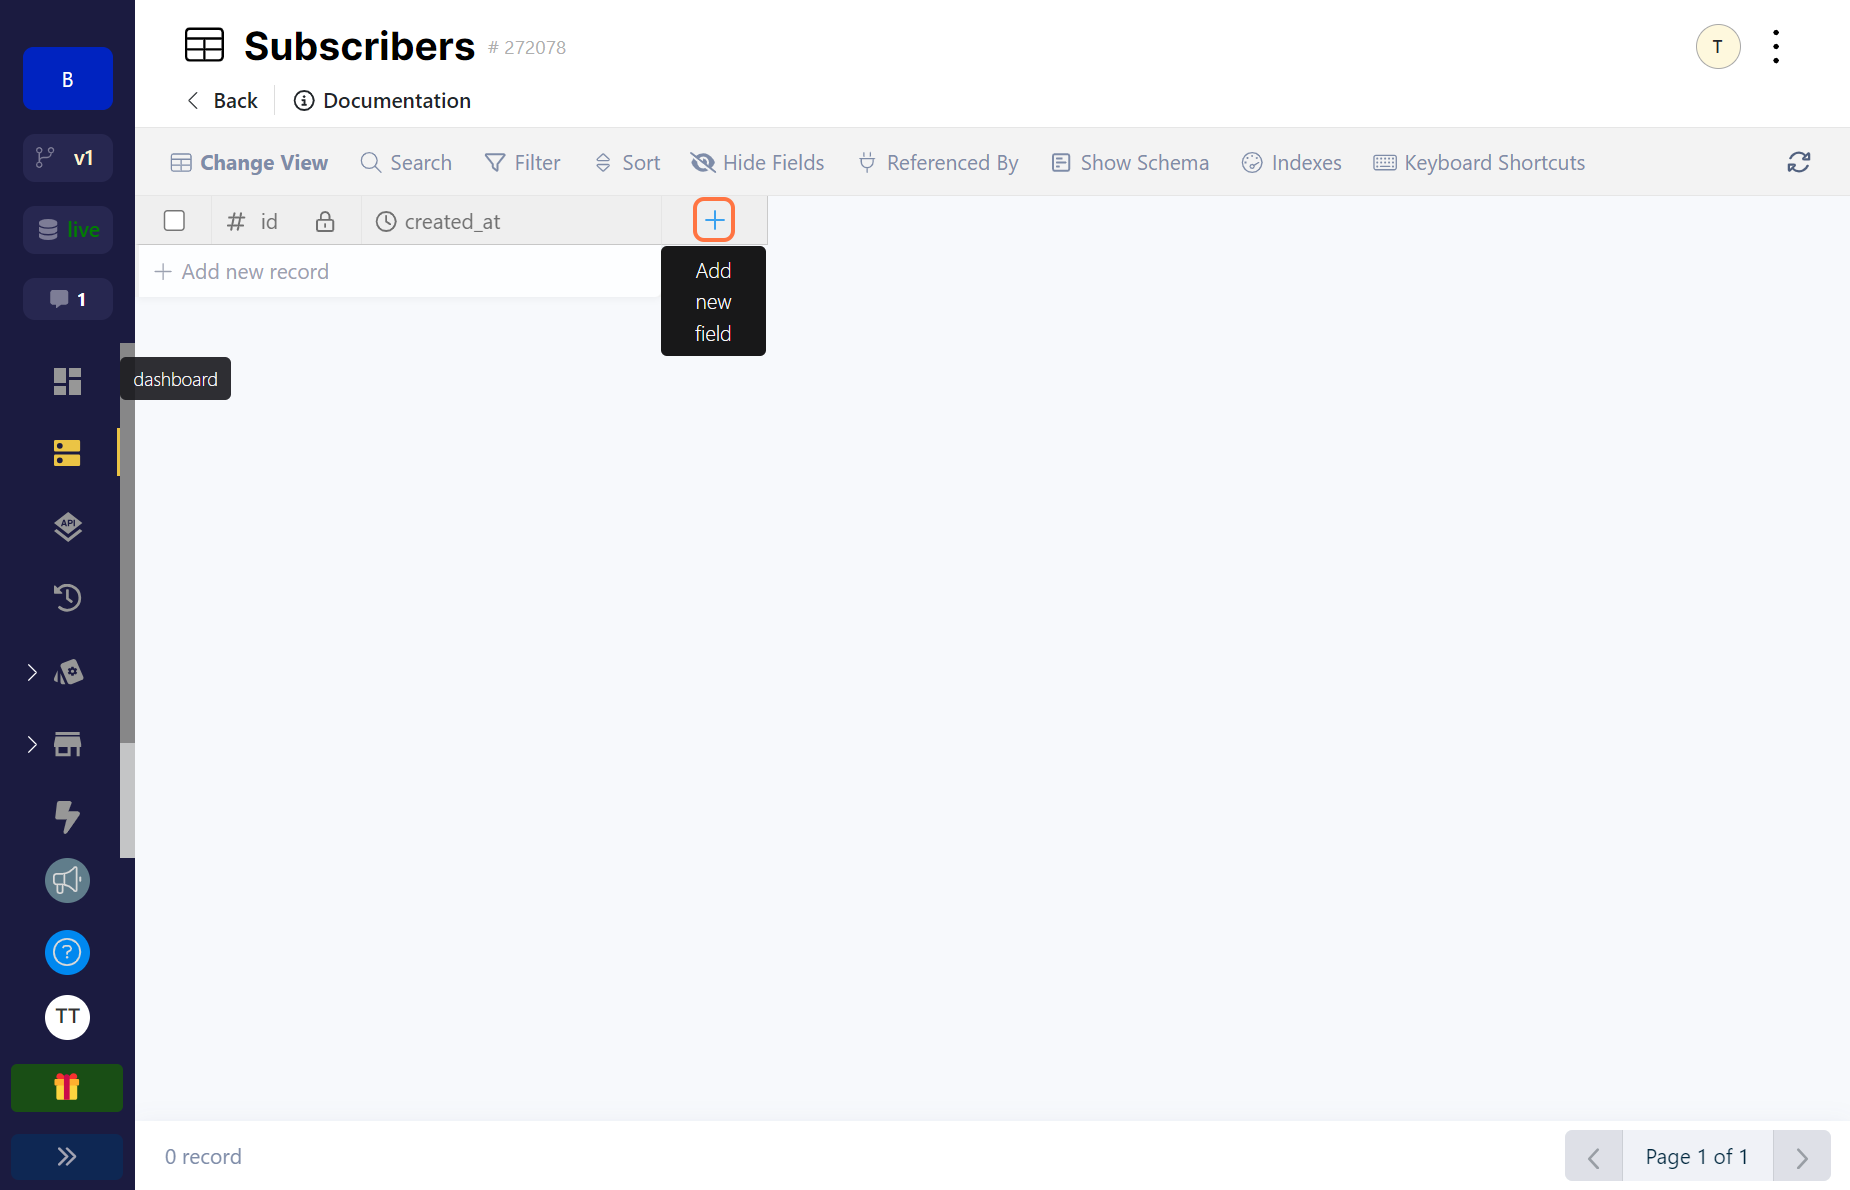
When you create a table, Xano automatically adds an id and created_at field. The id field assigns a number value to each record, you can always add your own unique id field if you prefer. The created_at field helps you know the exact time a record was created.
For our Subscribers table, we are going to add a Name and Email field. To add a new field, click on the plus icon.
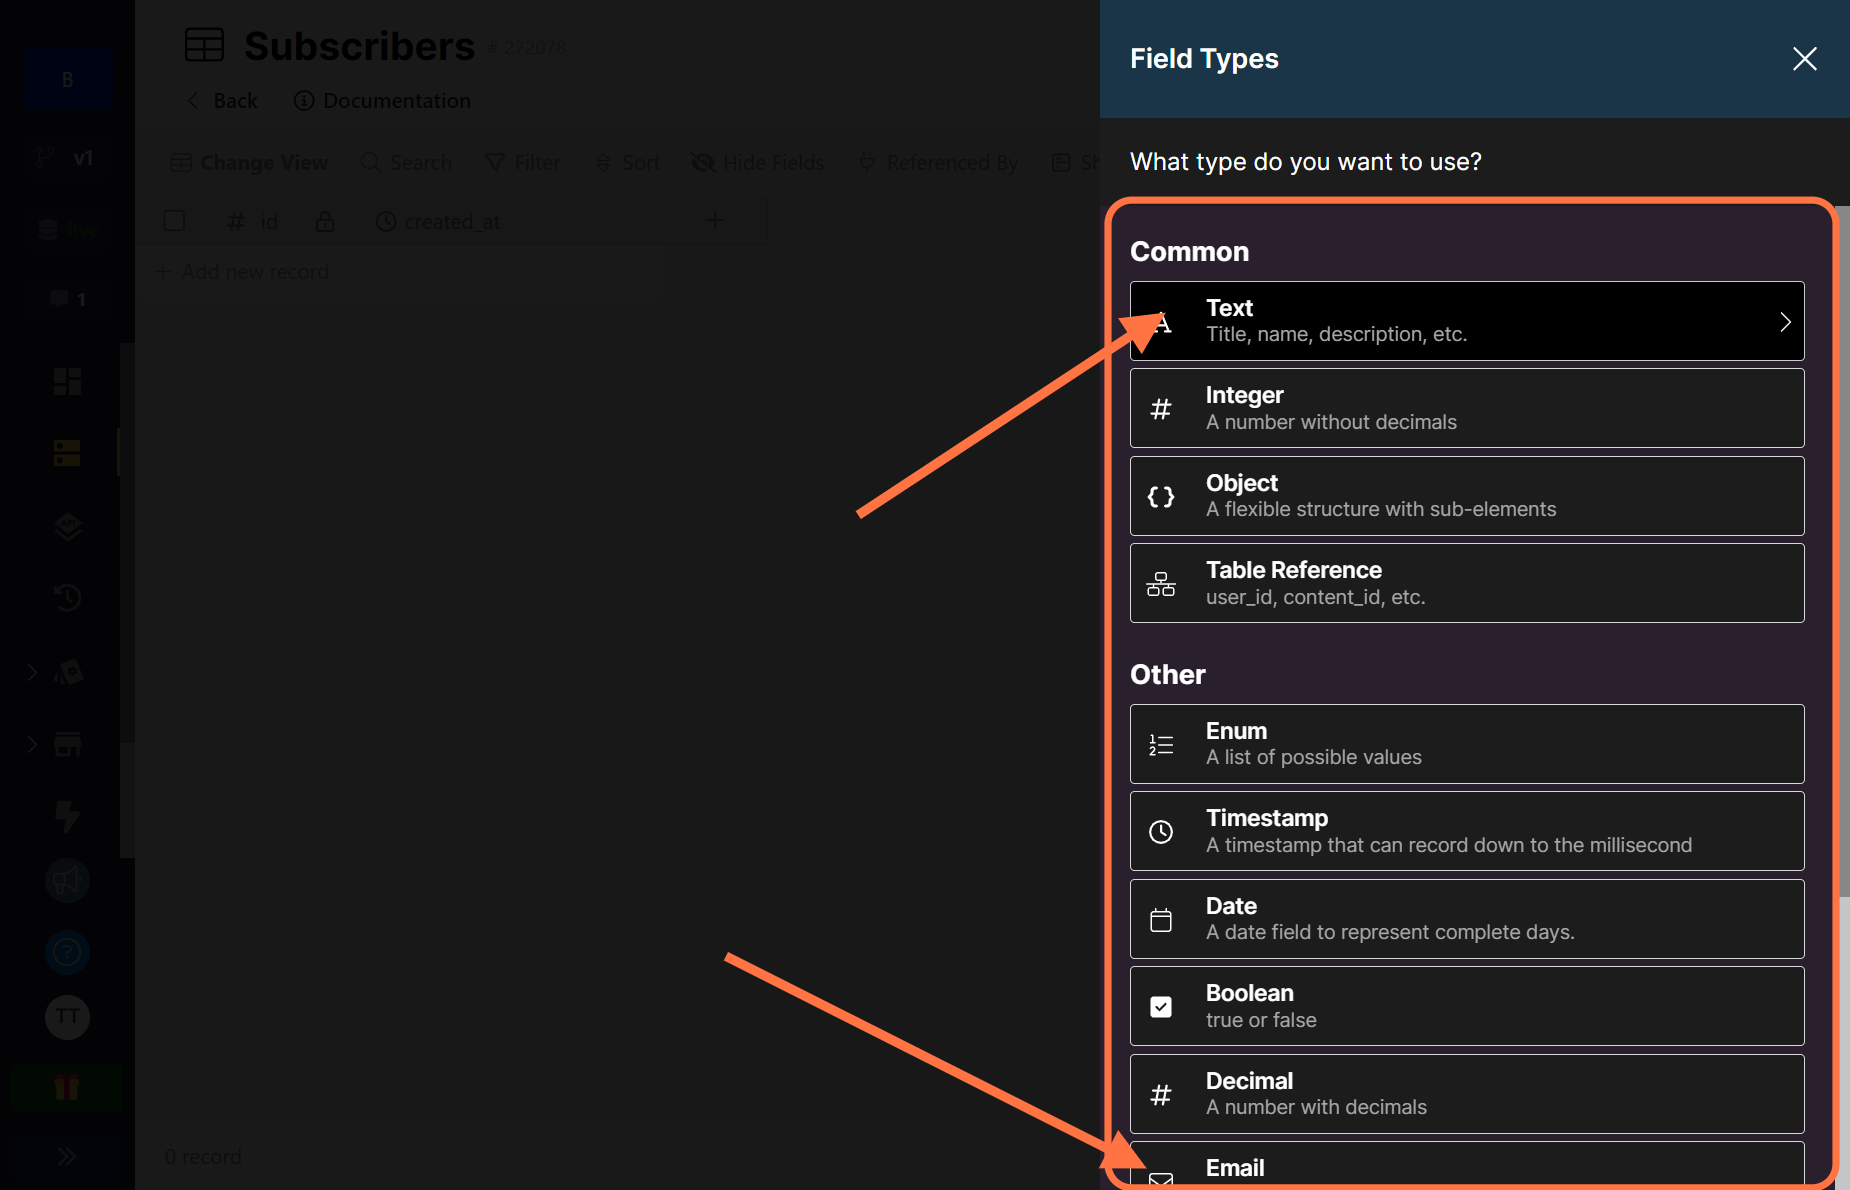
There are many field types supported by Xano. You can read all about them here. In our case, we just need the Text and Email field type.
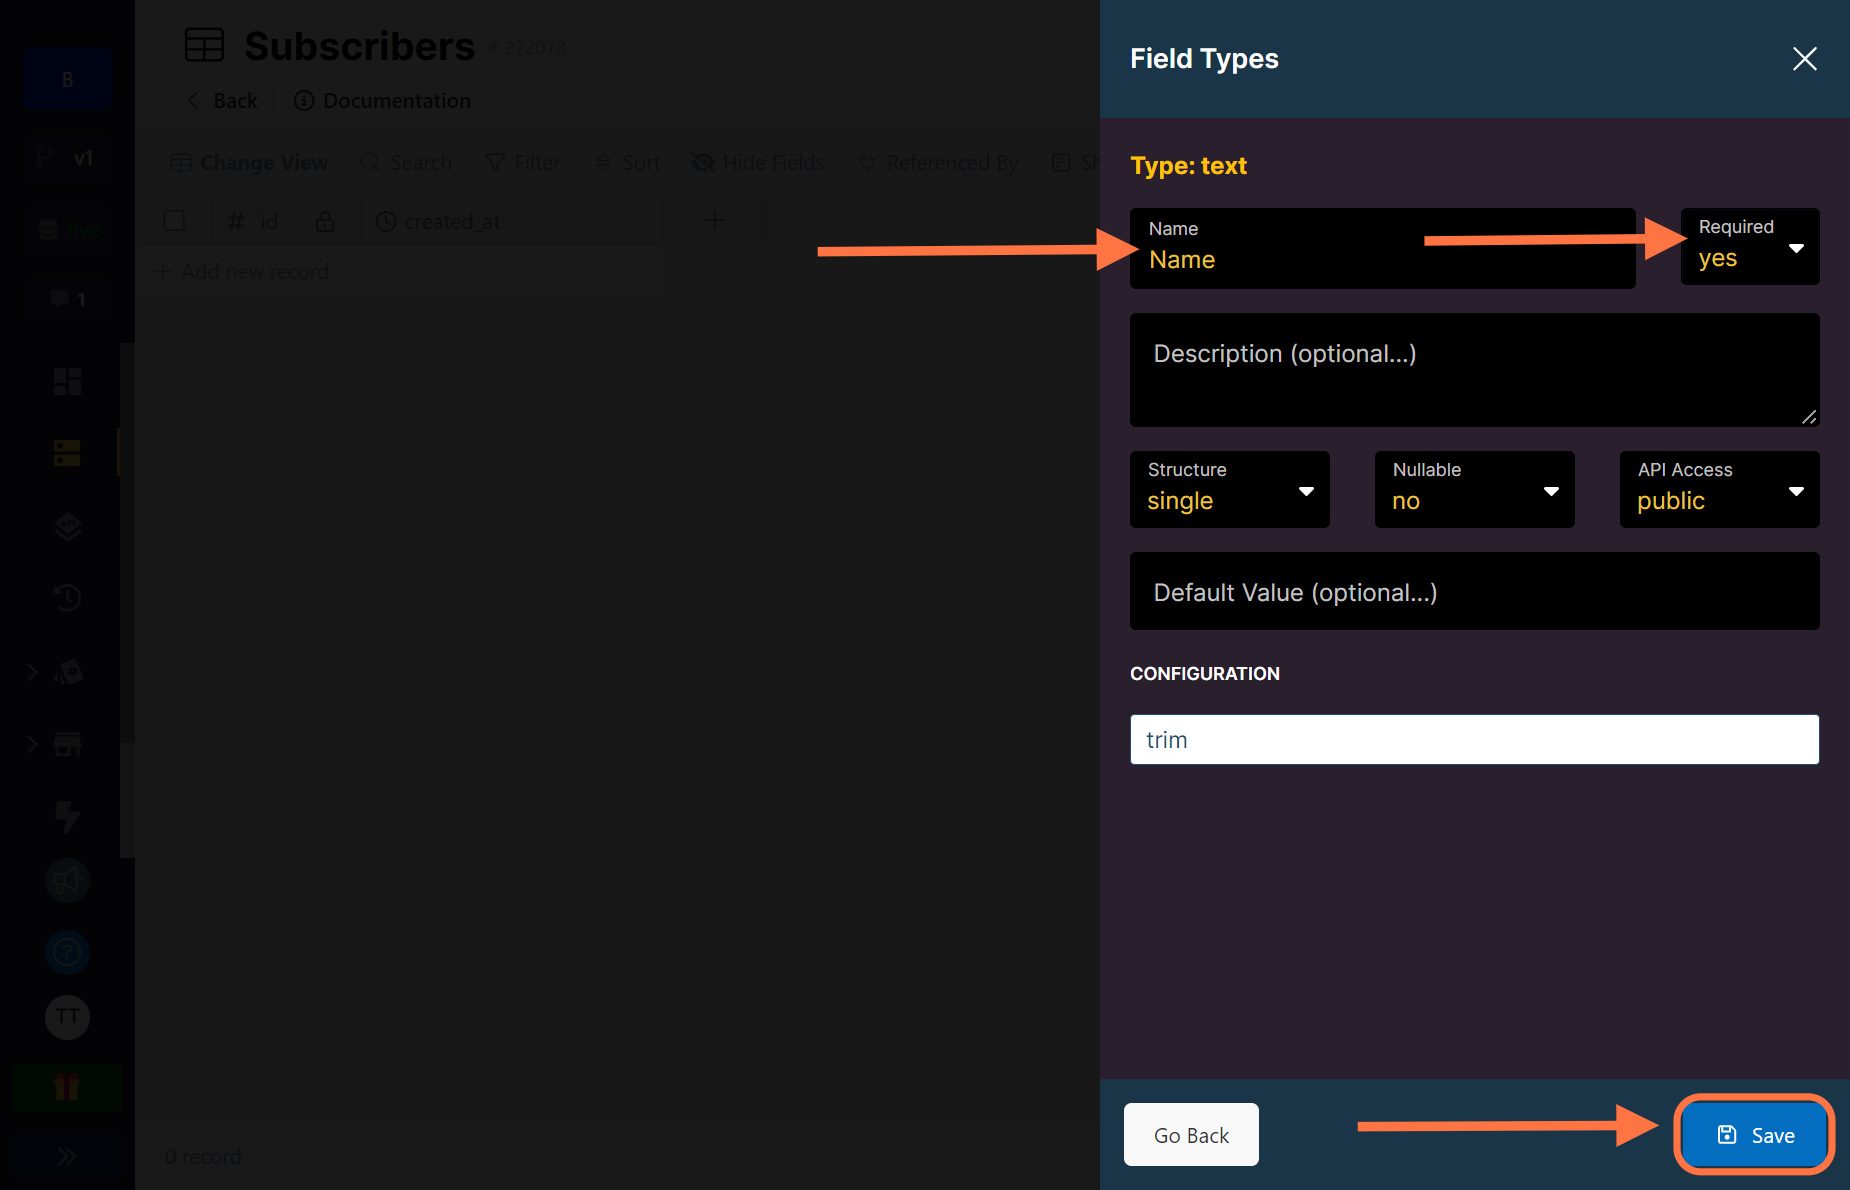
Select Text field type, give it a name then choose between yes or no for the required option and save. Do the same for the Email field type as well.
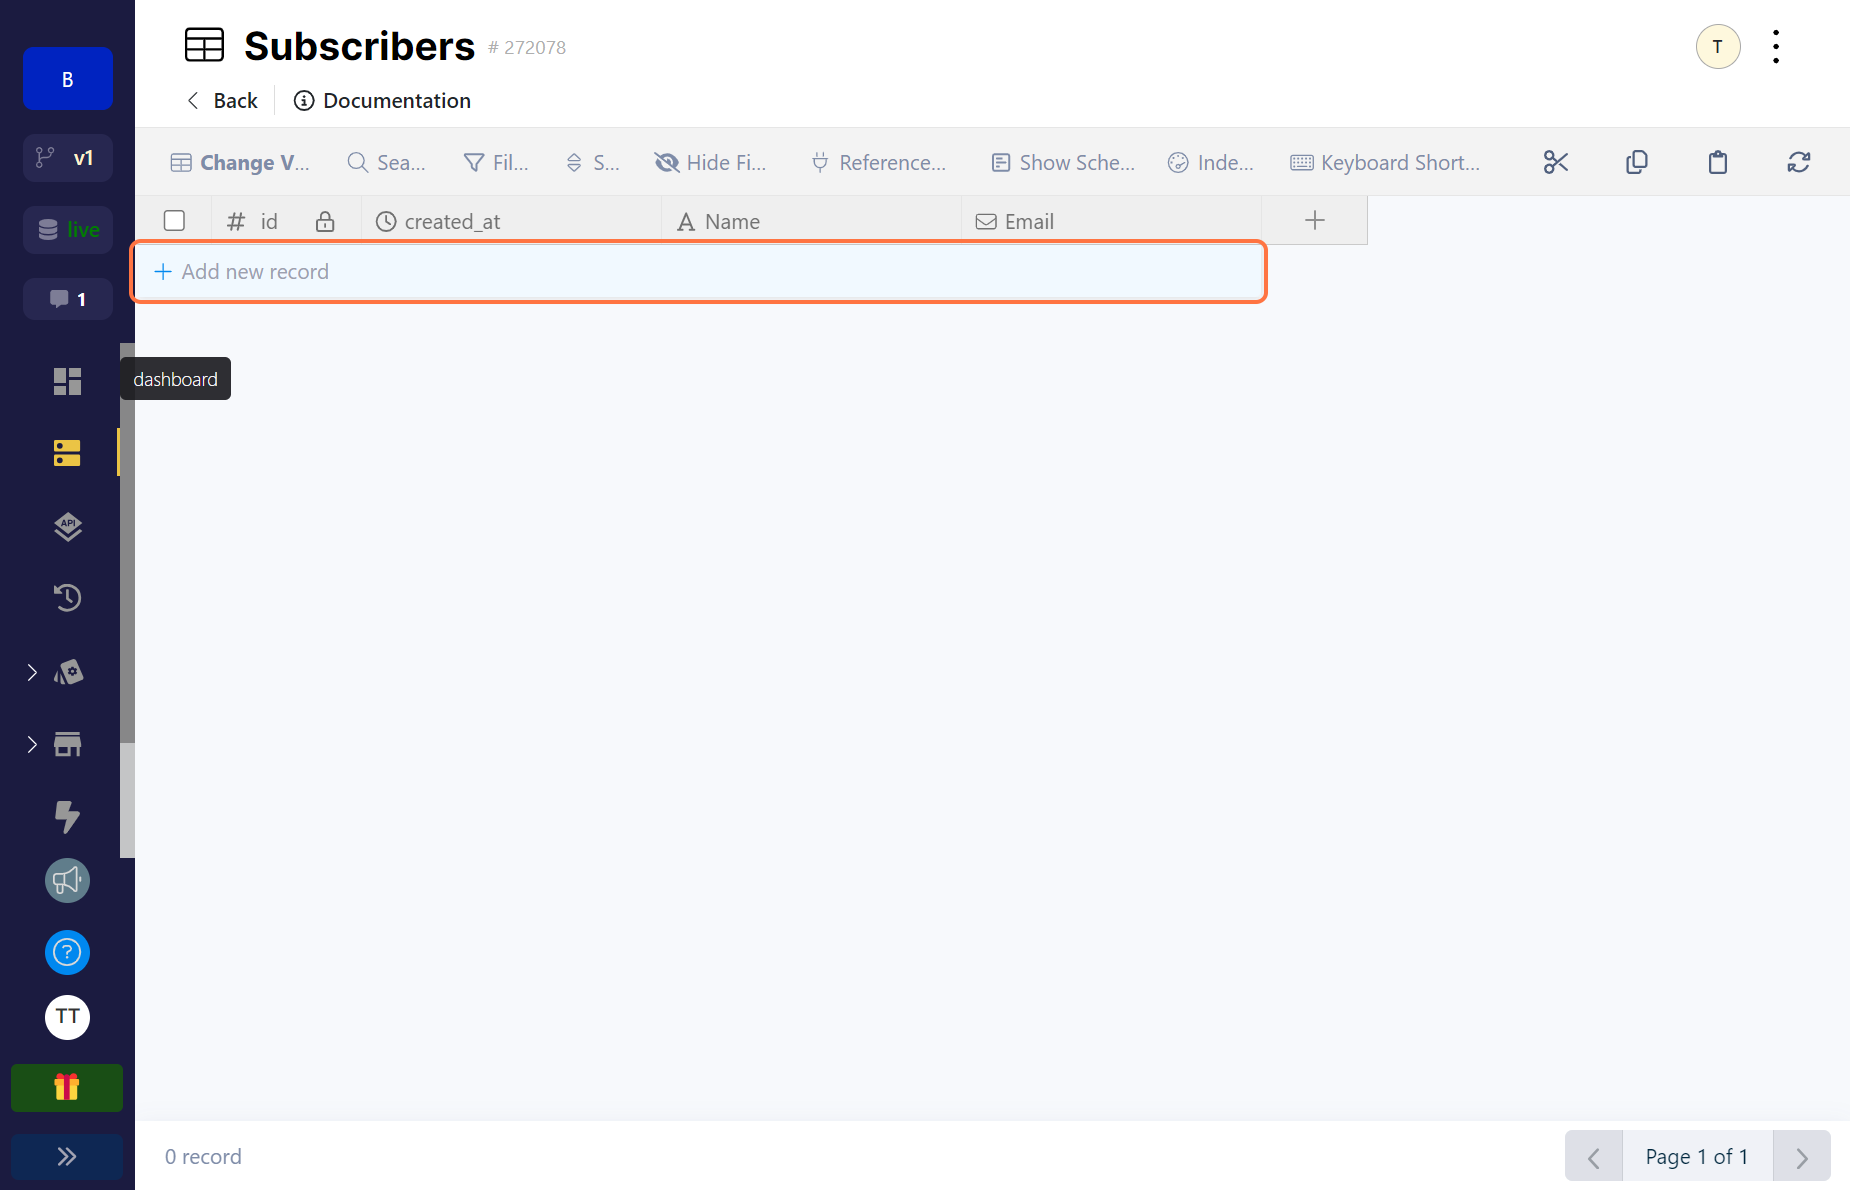
This is how our table looks like once the fields are added. You can click on the Add new record button to add a new subscriber or you can add one via an API. We’ll get to that when we’re building out endpoints.
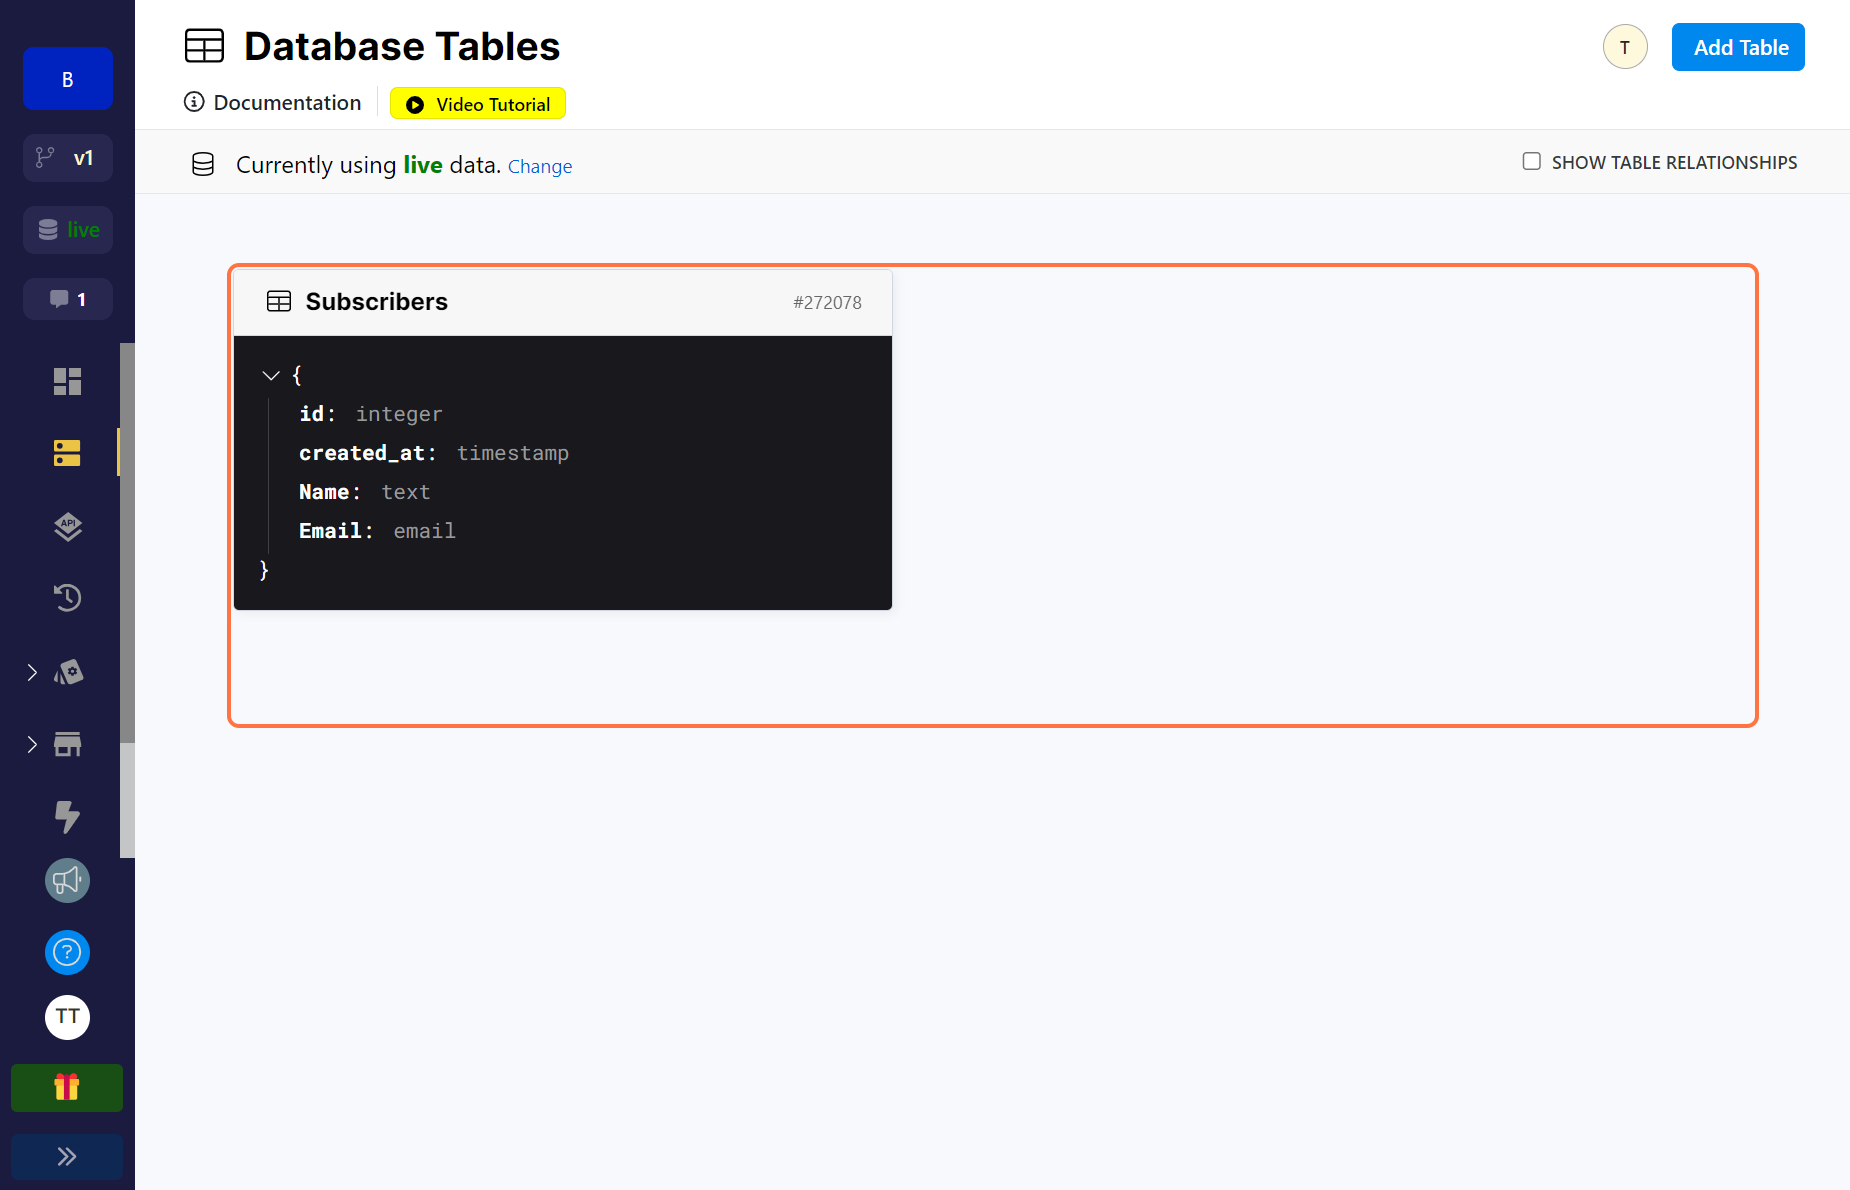 This is how the Database page looks when you have a table.
Structure the database
Now that you have some idea on how to create tables in Xano, we can start to structure our databases.
Let’s think about how our tool works again to try to determine how . For every particular action a customer takes, we want to send an event. If you guessed that we need 3 tables, you guessed right.
Actions
Actions are what we are assigning numerical value to so we know how much a customer cost or made us when they take it. It is from these actions that we derive the metrics that we will be tracking. You can have as many actions as possible and you can have multiple metrics from one action. Here are some examples to help you understand:
| Action | Metrics | Type |
|---|---|---|
| When a customer speaks to a support rep | support-minutes | Cost |
| When a customer makes a fixed plan deposit | processing-fees | Cost |
| When a customer makes a fixed plan deposit | interest-earned | Revenue |
| When a customer successfully refers a friend | referrer-reward | Cost |
| When a customer successfully refers a friend | referee-spend | Revenue |
Let’s go through the examples briefly using our imaginary savings startup Zee. When a customer speaks to a support representative, Zee tracks the support minutes to know how much each customer costs them in terms of support.
When a customer makes a deposit to a fixed savings plan, Zee tracks how much in processing fees that deposit has cost them, they also track how much in interest they will be getting from that locked deposit.
And finally, when a customer successfully refers a friend to Zee, that customer costs Zee a certain amount that they will pay as a reward for the referral but Zee will also track how much they will make from the amount the referred friend spends.
This is our first database table.
Events
To continuously log these actions as they happen, they’ll be sent as Events. Every time a customer takes that action, we’ll pass them to the API along with the value of what that action costs or makes. Here’s another example to help you understand:
| Action | Metrics | Type | Value |
|---|---|---|---|
| When a customer speaks to a support rep | support-minutes | Cost | $0.000395 x Minutes spent by customer |
| When a customer makes a fixed plan deposit | processing-fees | Cost | 1.4% of the amount deposited |
| When a customer makes a fixed plan deposit | interest-earned | Revenue | 2% of the amount deposited |
| When a customer successfully refers a friend | referrer-reward | Cost | N500 |
| When a customer successfully refers a friend | referee-spend | Revenue | 2% of the amount deposited |
The cost of speaking to the support rep is the total number of minutes spent multiplied by the single cost of a minute like we calculated above. So if the customer spent 20 minutes, the value that will be passed in this event will be $0.0079.
If the customer made a deposit of N300,000 into their fixed savings account, this would have cost Zee N4200 but it would have also made them N6000. If you do the math further you can tell whether they made a profit or loss based on this single action by their customer.
If the customer makes a successful referral to their friend, Zee would have to spend N500 as a reward to the customer for bringing in a friend but if the customer’s friend deposited N500,000, this means that Zee also earned N10,000.
This is our second table.
Customer
The Customer table is the third and last database table that we need. It tells us who took an action, when and how many times the event happened.
Now let’s create the tables. We’ll identify the properties we need for each column and their field type. Remember there’s a default id and created_at field with each table.
Metrics Table (Actions)
| Field Name/Property | Field Type | Description | Required? |
|---|---|---|---|
name | Text | Metric name e.g support-minutes | Yes |
unique_id | Text | A unique id. Preferably UUID | Yes |
description | Text | The action or metric description | No |
type | Enum (Cost, Revenue) | Whether cost or revenue | Yes |
total_number_of_events | Integer | Total events logged for this metric | Yes |
Events Table
| Field Name/Property | Field Type | Description | Required? |
|---|---|---|---|
metric | Text | The metric being tracked | Yes |
unique_id | Text | A unique id. Preferably UUID | Yes |
value | Integer | The value of the metric tracked | Yes |
customer | Table Reference | The customer who took the action | Yes |
Customers Table
| Field Name/Property | Field Type | Description | Required? |
|---|---|---|---|
email | Text | Email of customer | Yes |
unique_id | Text | A unique id. Preferably UUID | Yes |
additional_properties | JSON | Additional info about the customer | No |
Next, we’ll build out the functions for the API.
Build out the endpoints
We’ll be building three endpoints. The first to create a metric that the business wants to track, the second to create a customer and the last to log an event every time it happens, the metric for the action that was taken and the customer who took the action.
Let’s take them one by one.
Create a new customer
First, head over to the API page on Xano and click on the button to Add API Group.
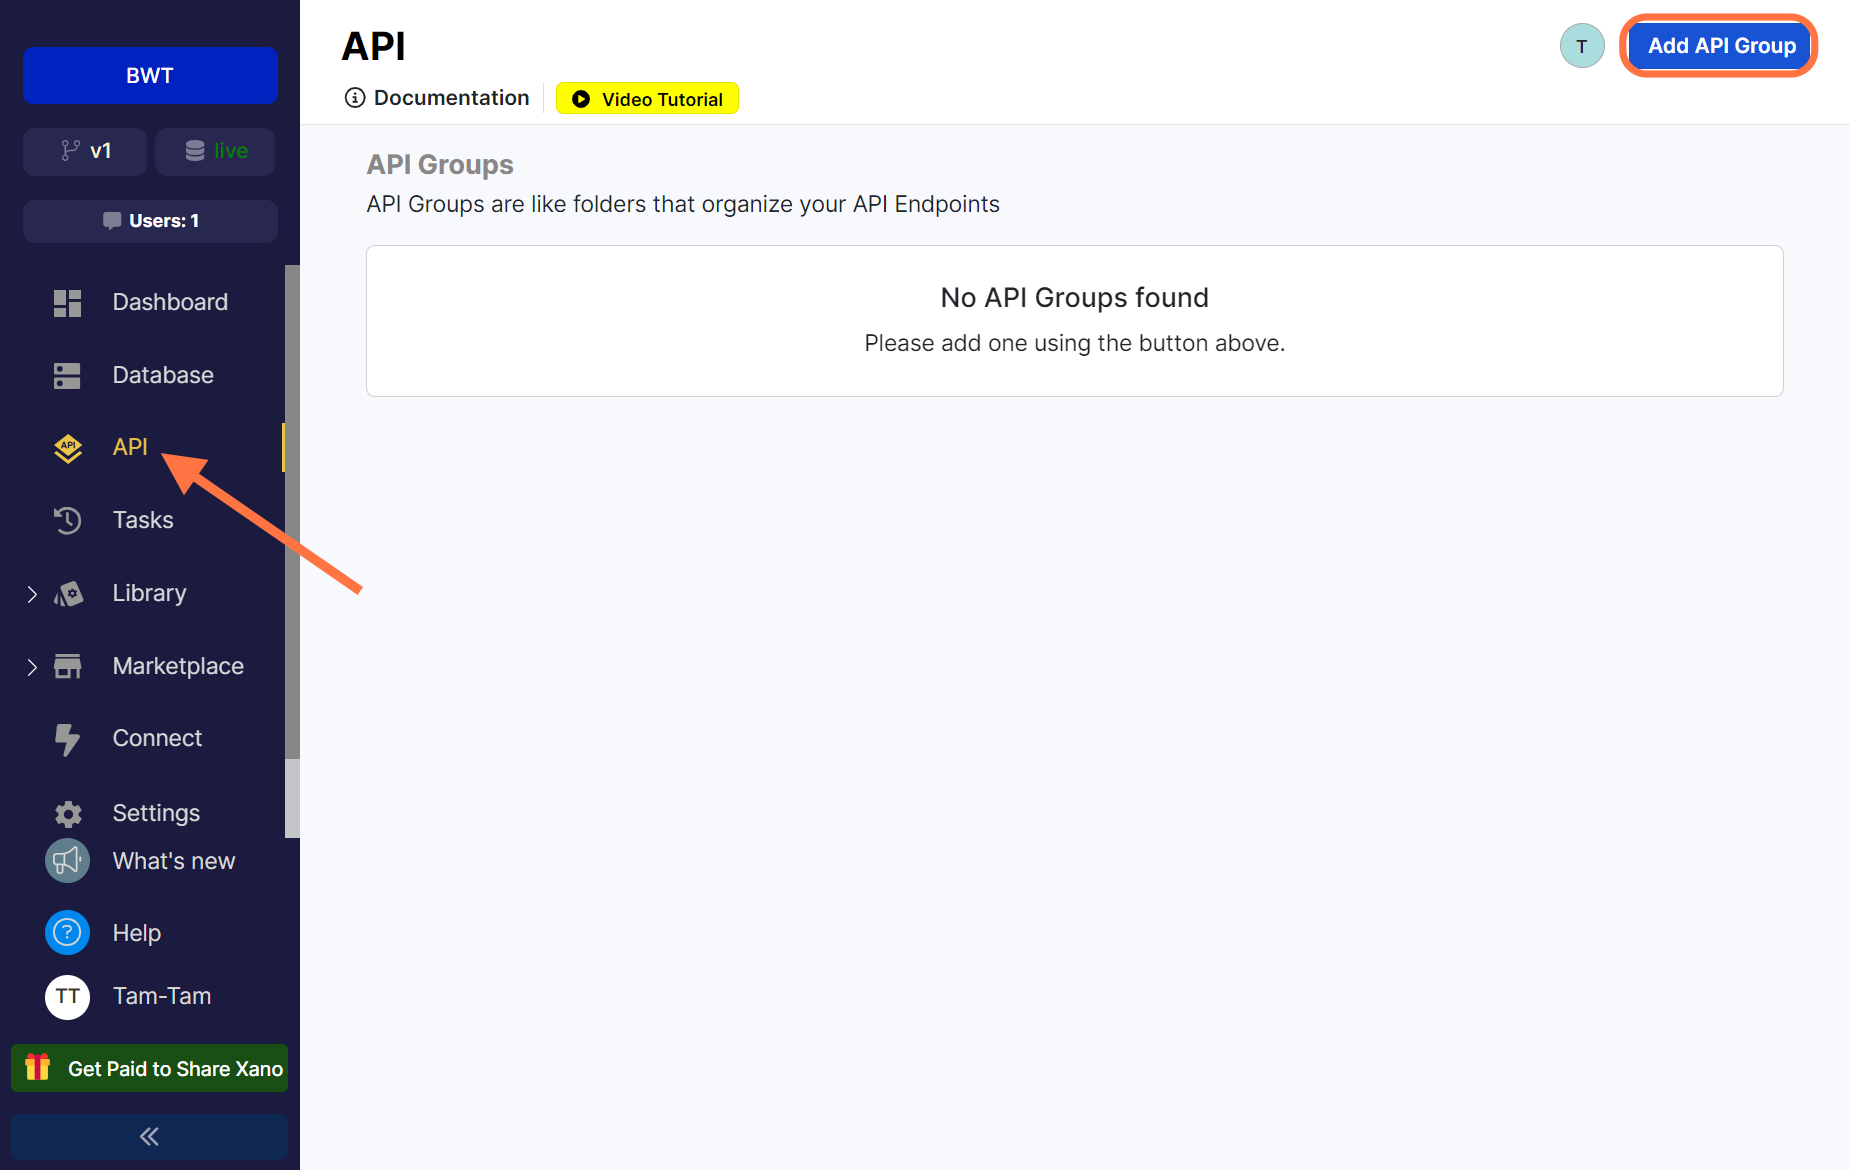
Xano allows you to arrange your endpoints in groups, so you can create as many groups as you want for different APIs. Here, we just need one.
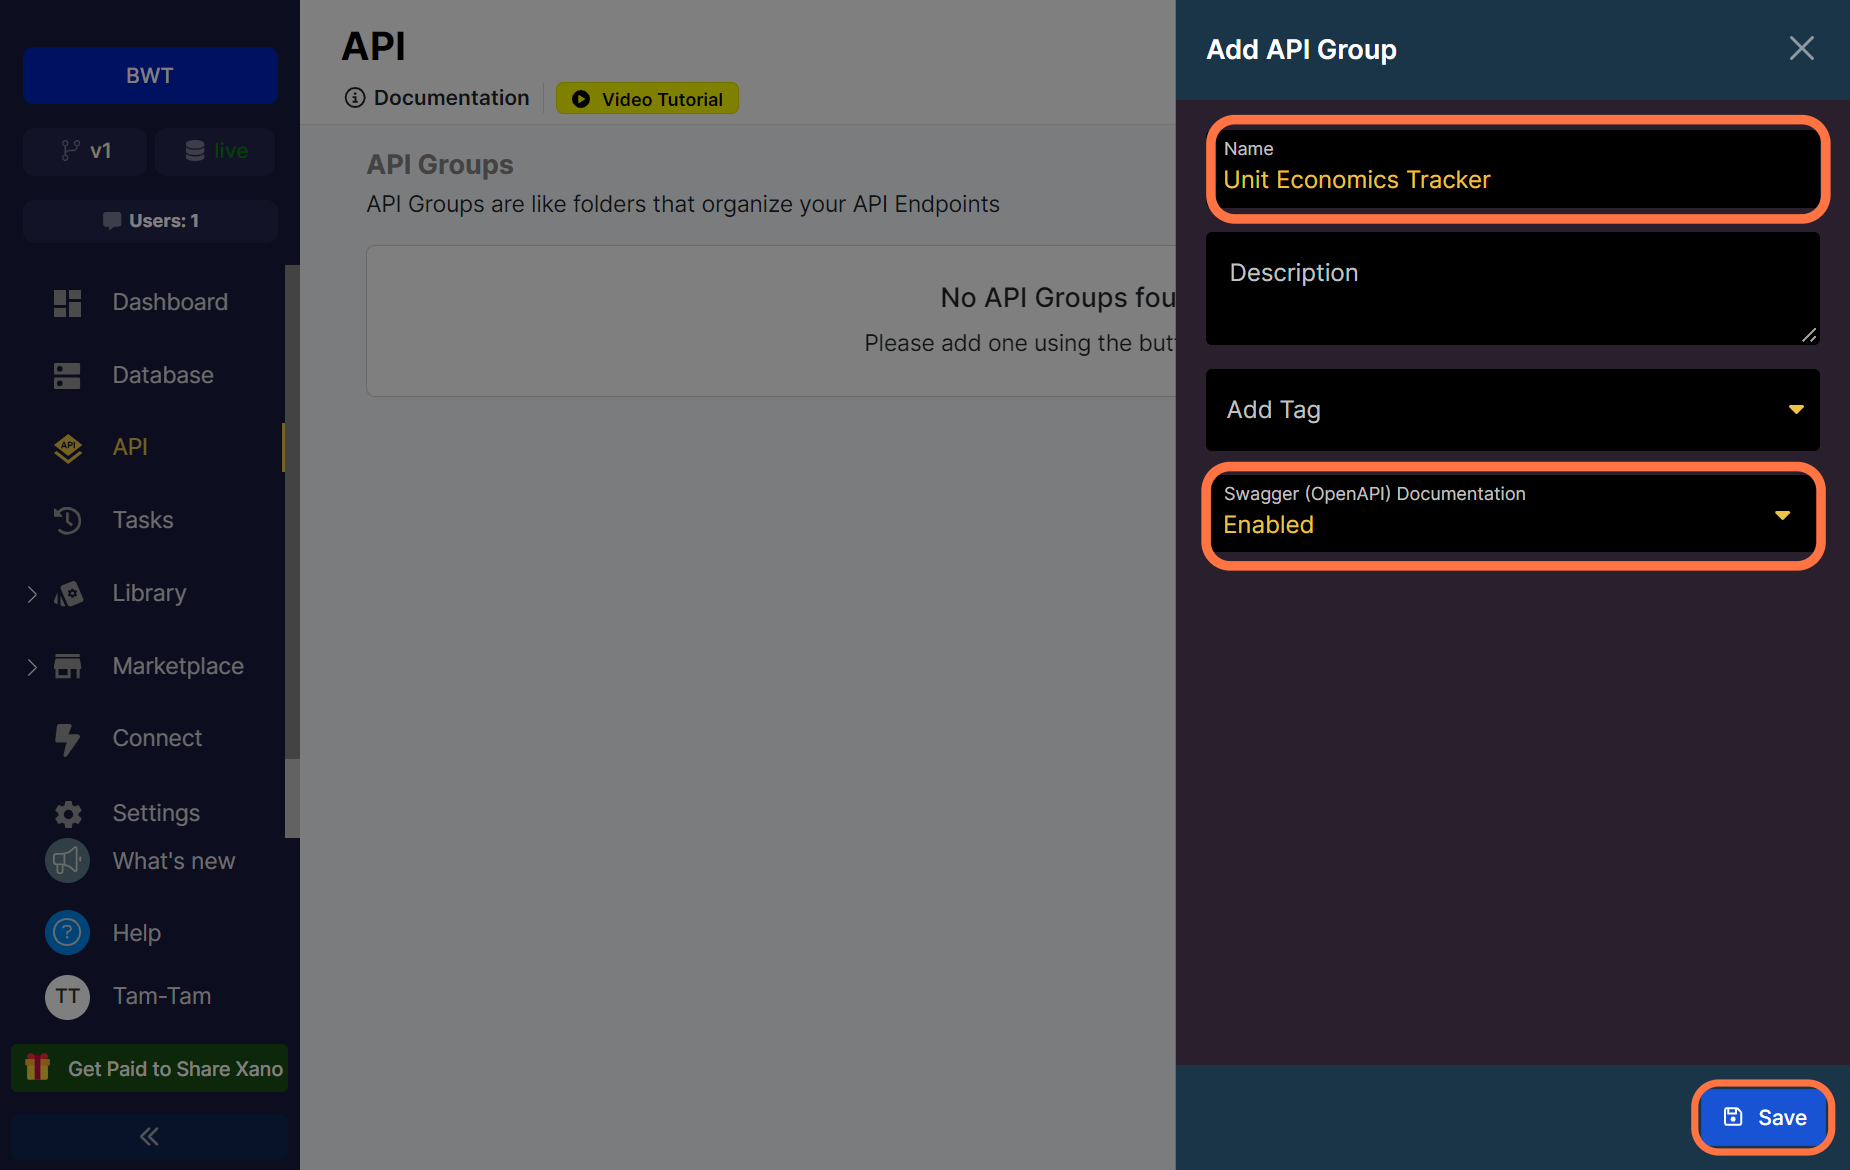
Give your API Group a name. I’m naming Unit Economics Tracker. Also leave the Swagger Documentation option as Enabled and save. You can have it disabled if you like as well but the option gives Xano the permission to automatically create a Swagger documentation for you.
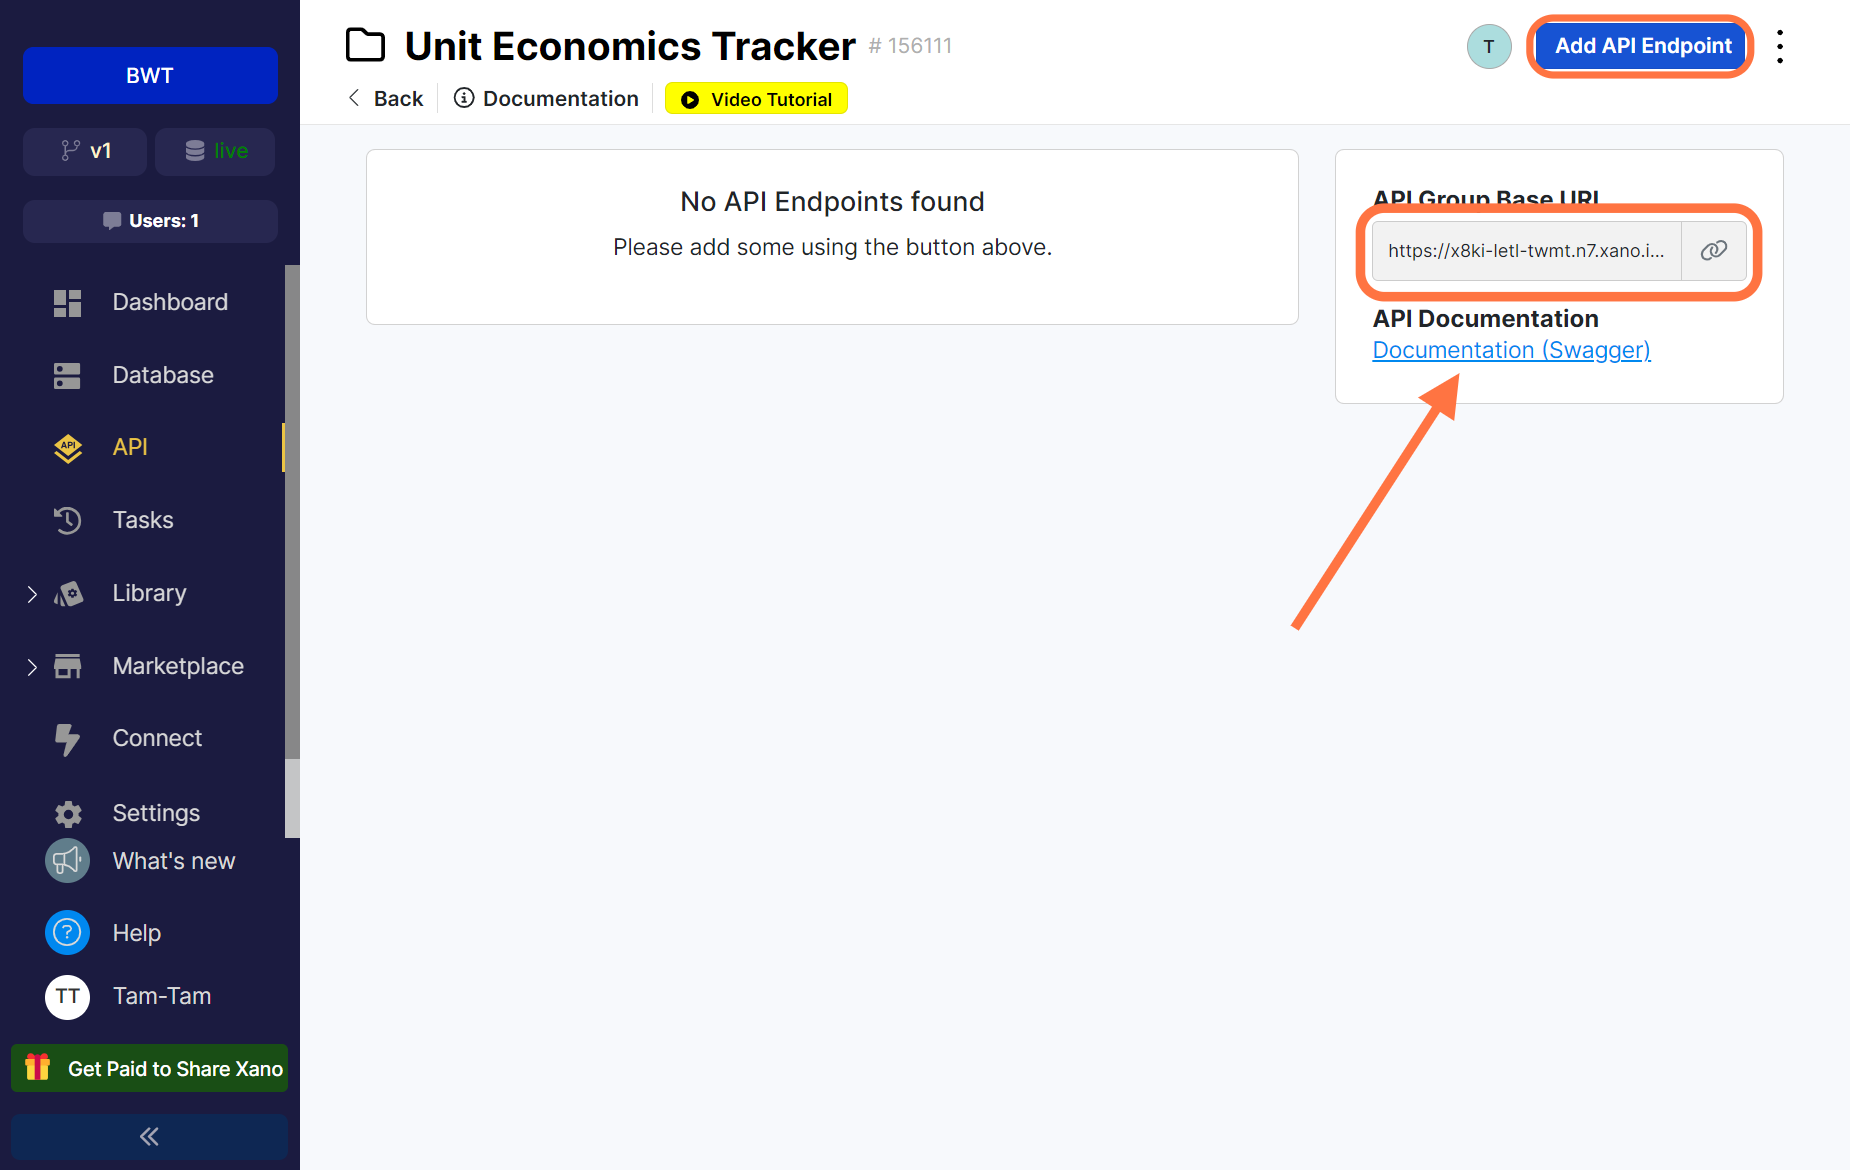
At the right side, you can see the link to the Swagger API documentation as well as the base URL for your endpoints. Next, click on the button to Add API Endpoint.
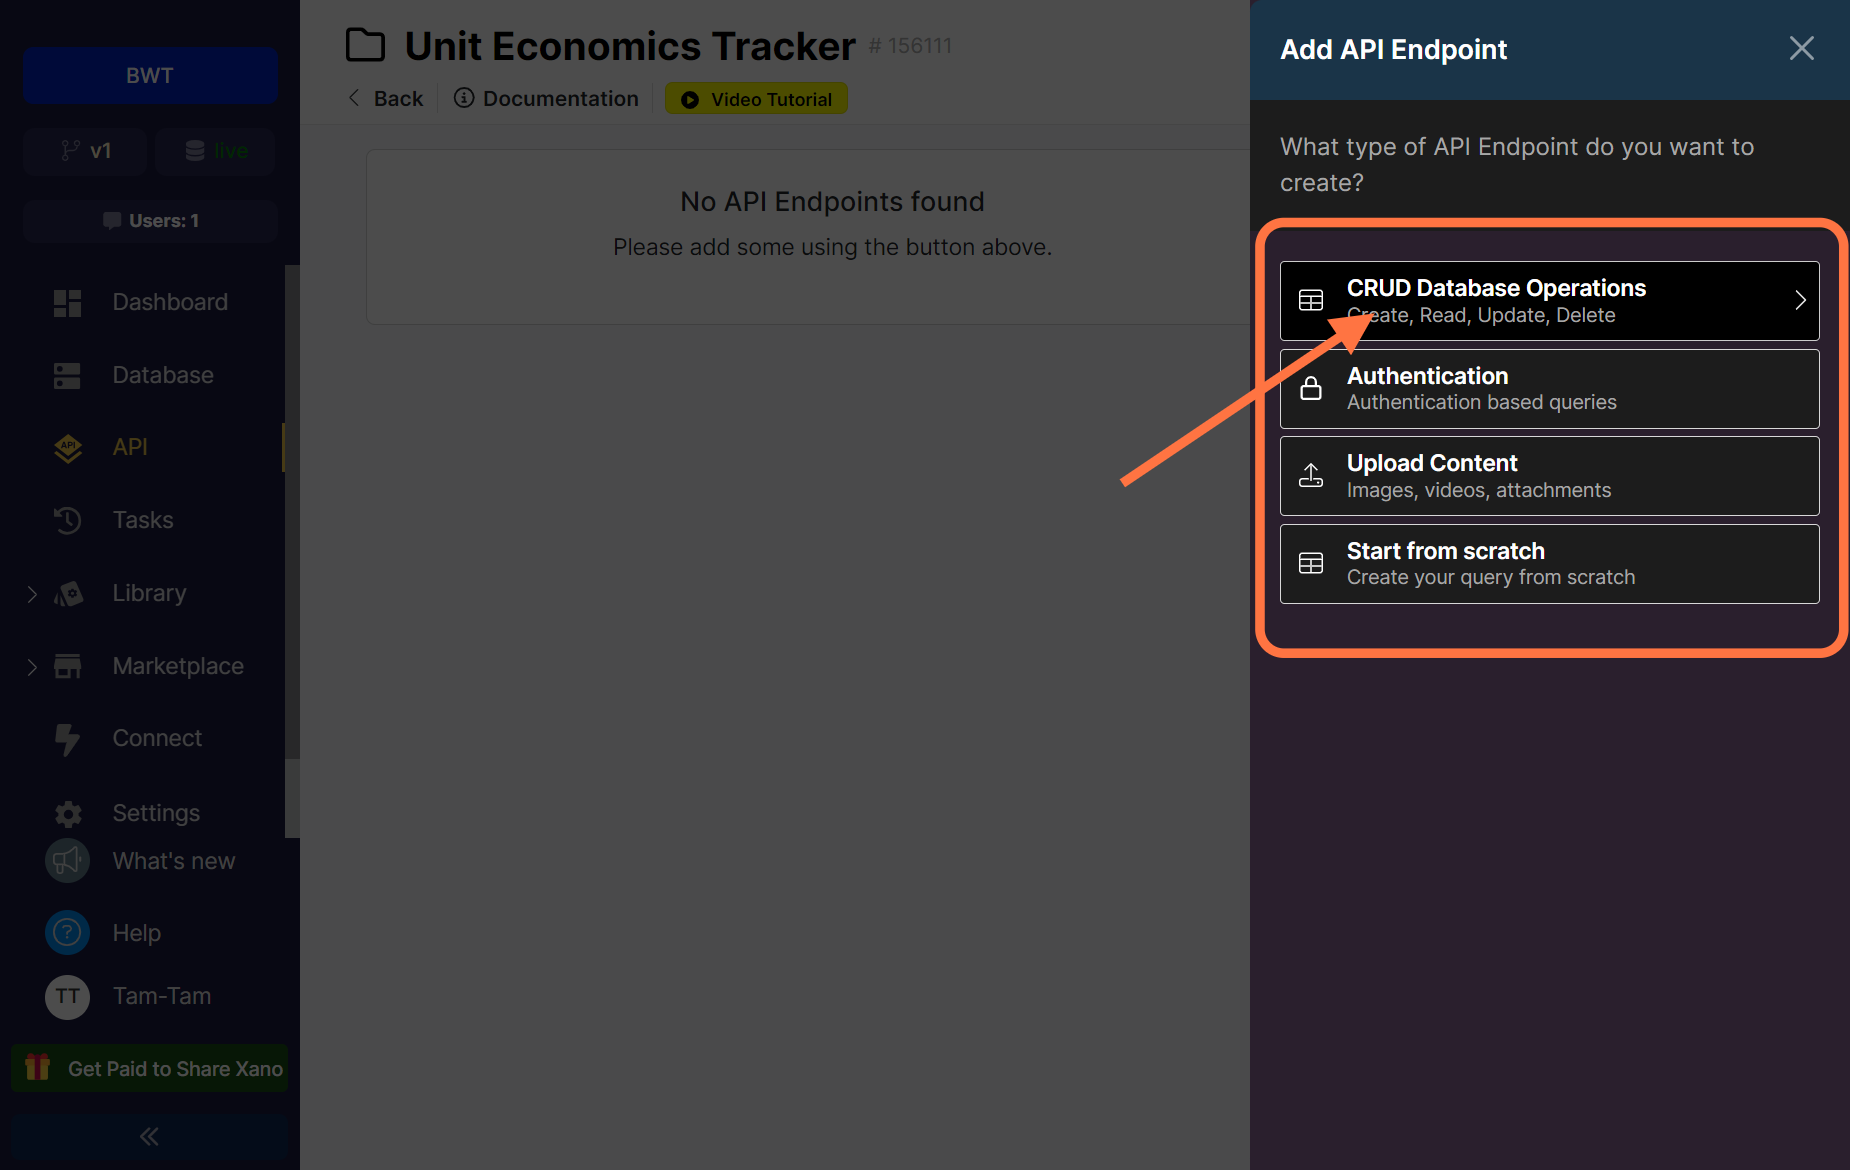
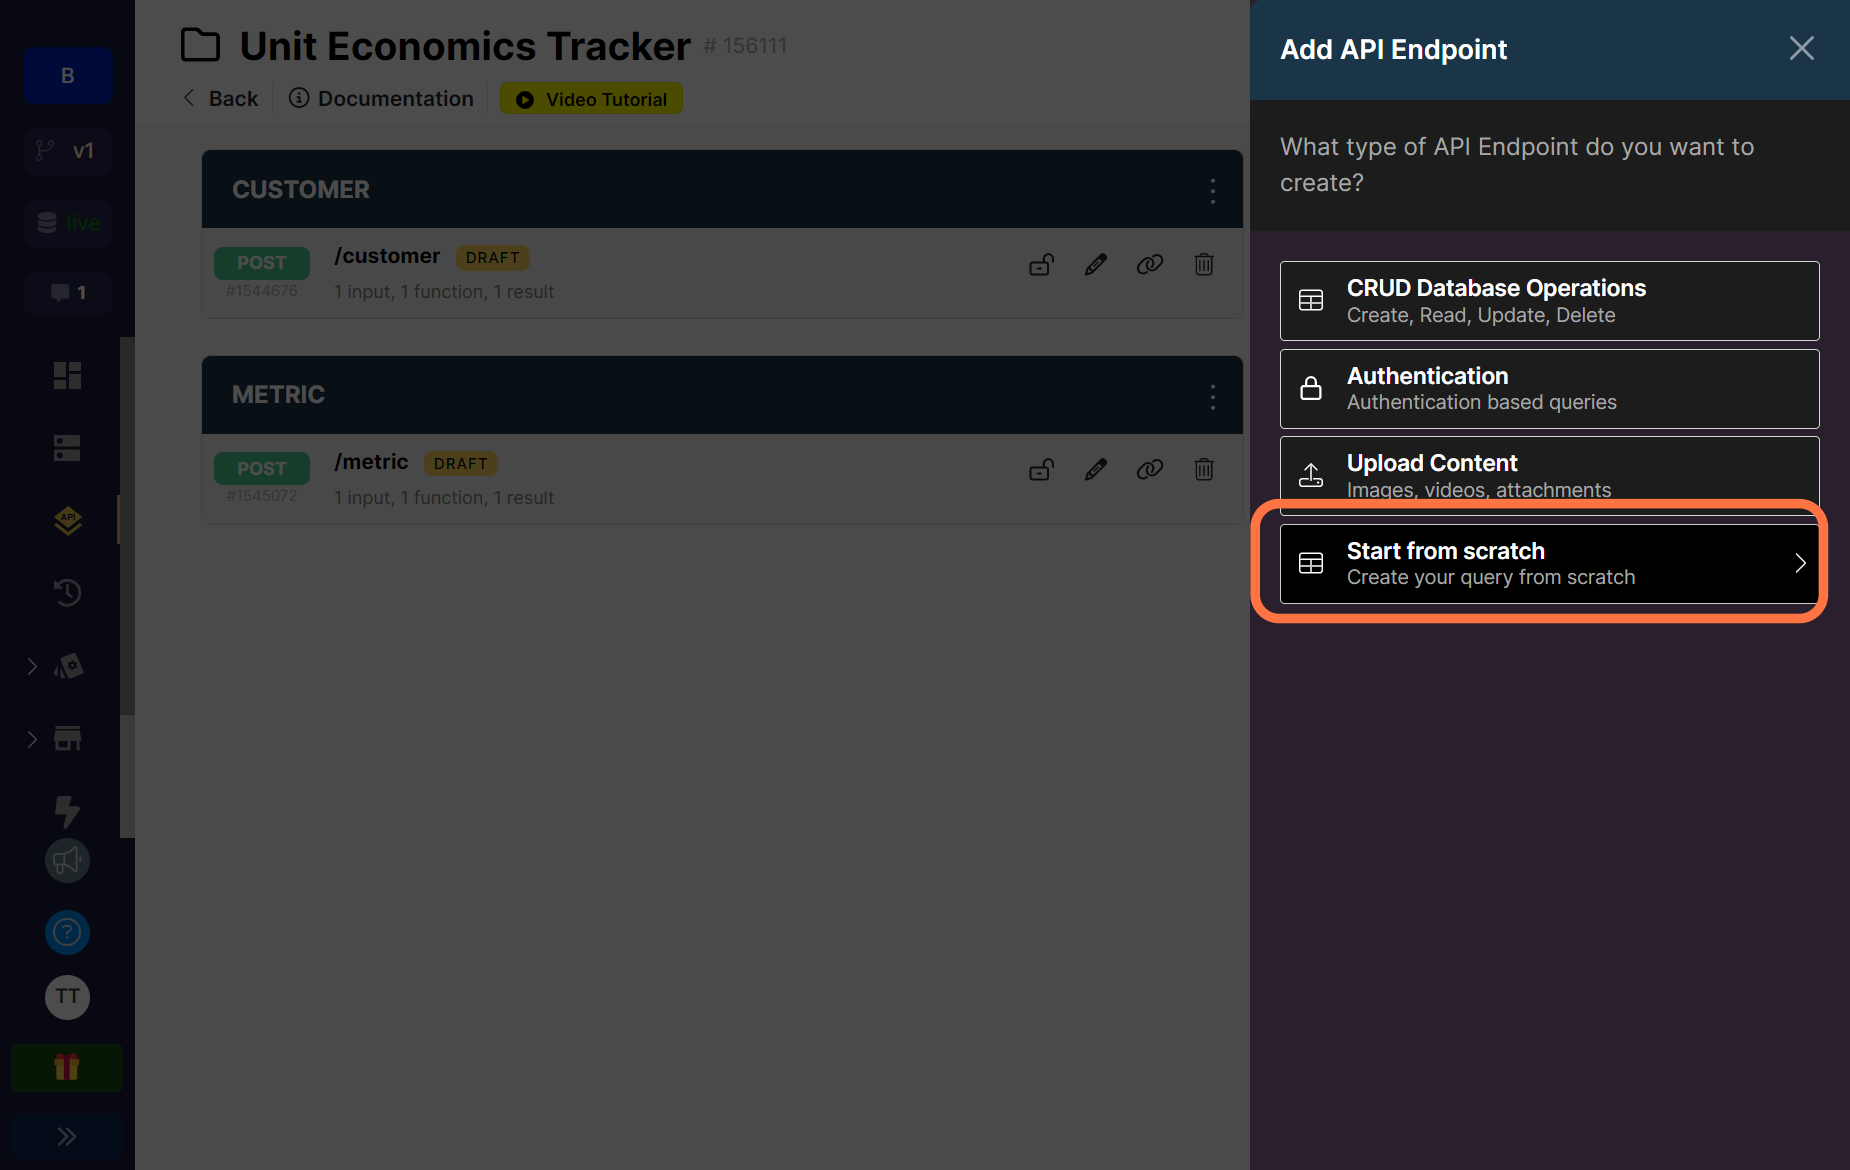
There are four options when creating an endpoint with Xano.
- The CRUD operations which allow you create endpoints to create, read, update or delete a record in the database.
- Authentication based queries for endpoints that have to do with signing and logging users in.
- Content Operation to create endpoints for uploading attachments, images and videos and finally,
- The option to build your endpoint from scratch.
Click on the CRUD Database Operations option.
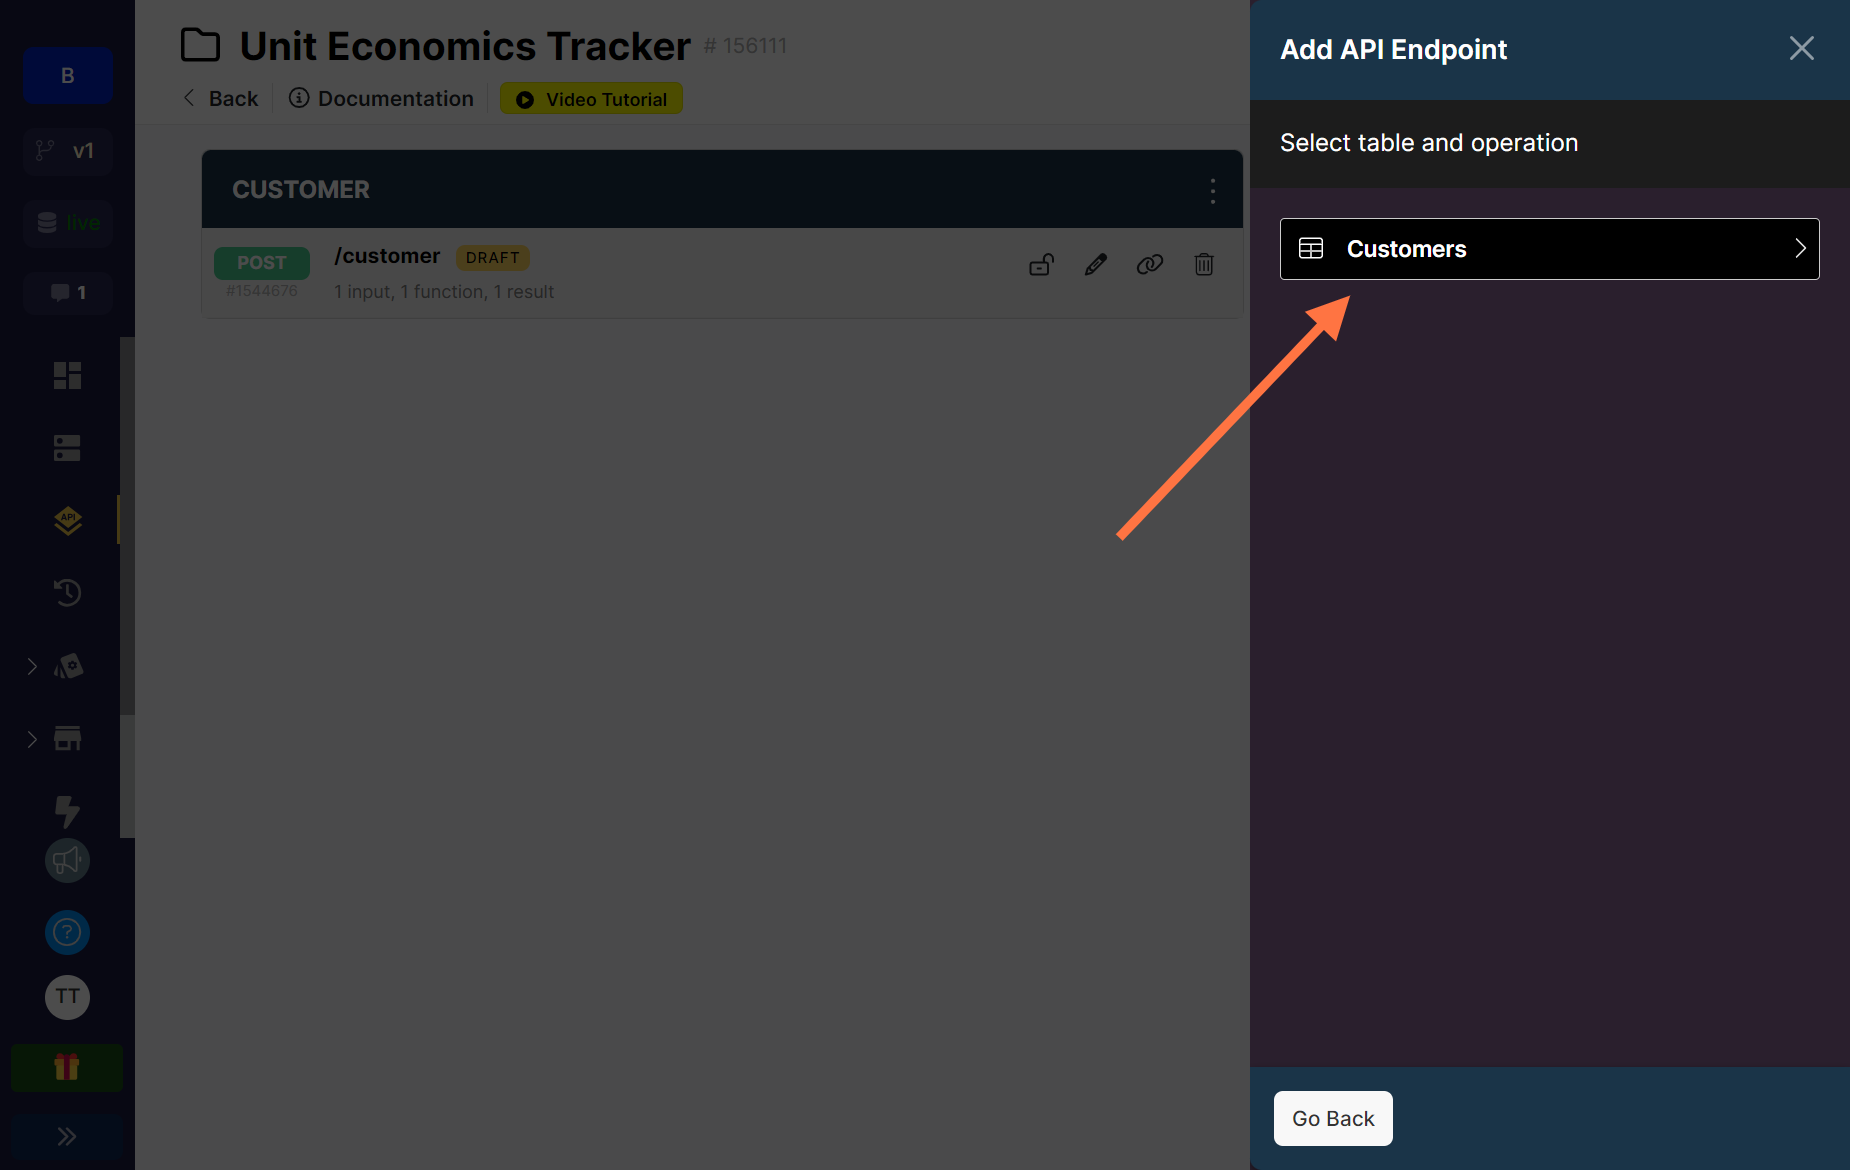
You’ll see a list of all your database tables here. Click on Customers.
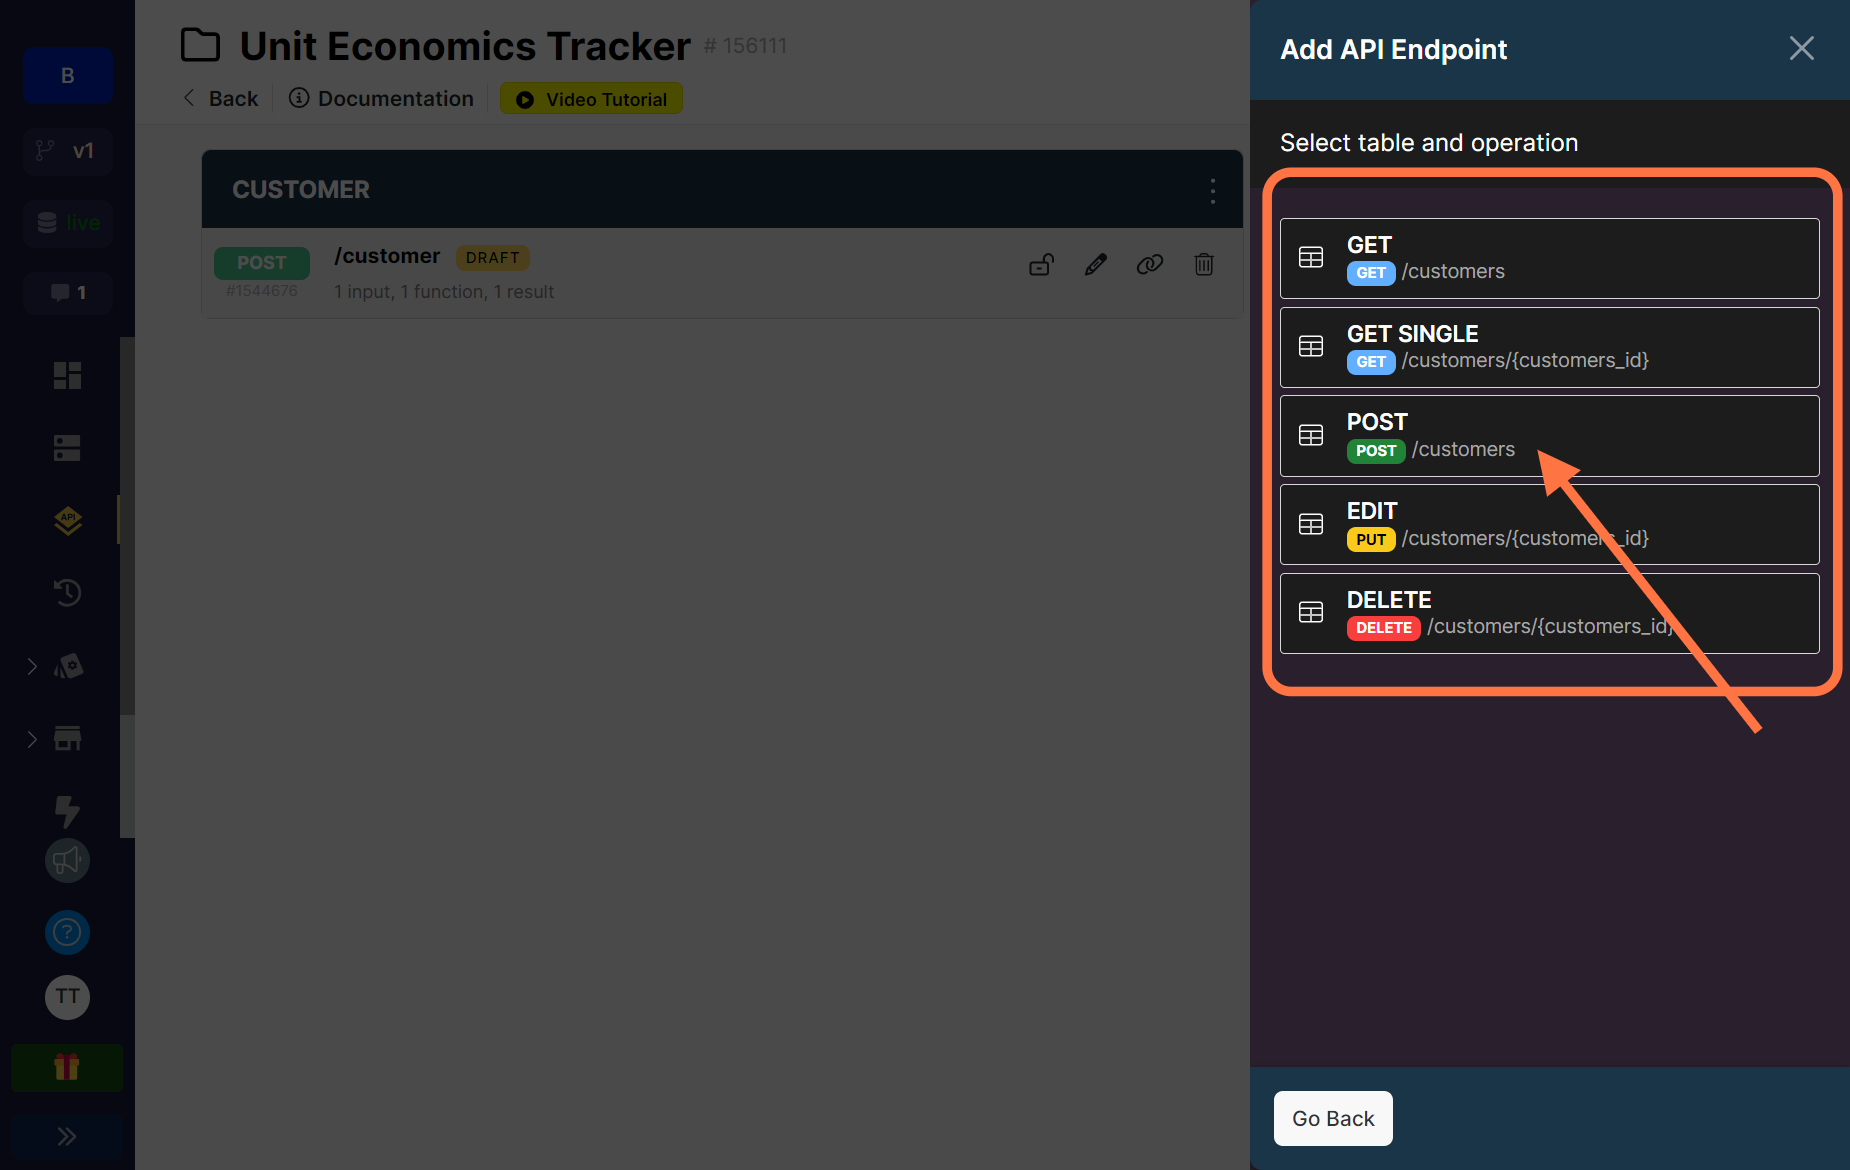
Next, select the POST operation which is for creating new records.
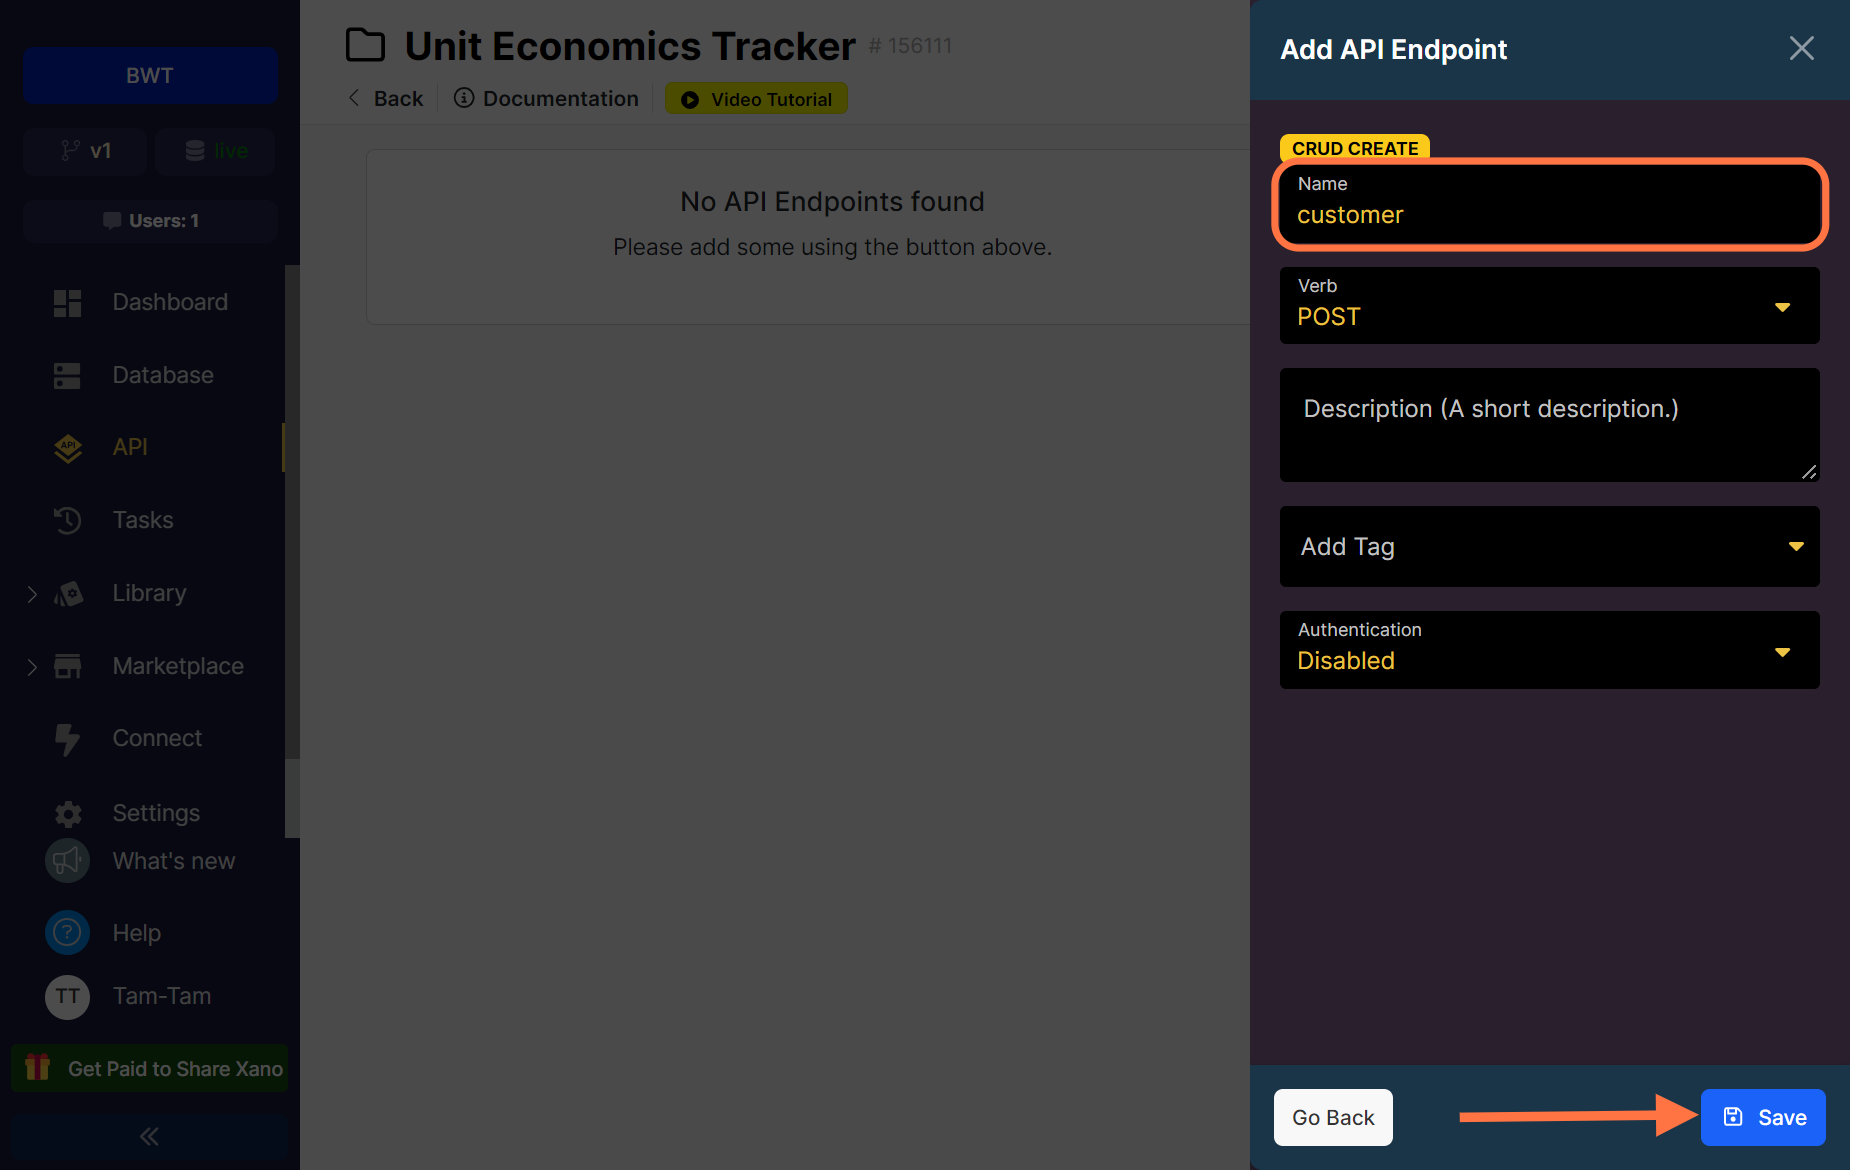
You can leave the name as it is or edit it if you like. I changed mine from customers to customer. Also leave the Authentication option as Disabled for now and save.
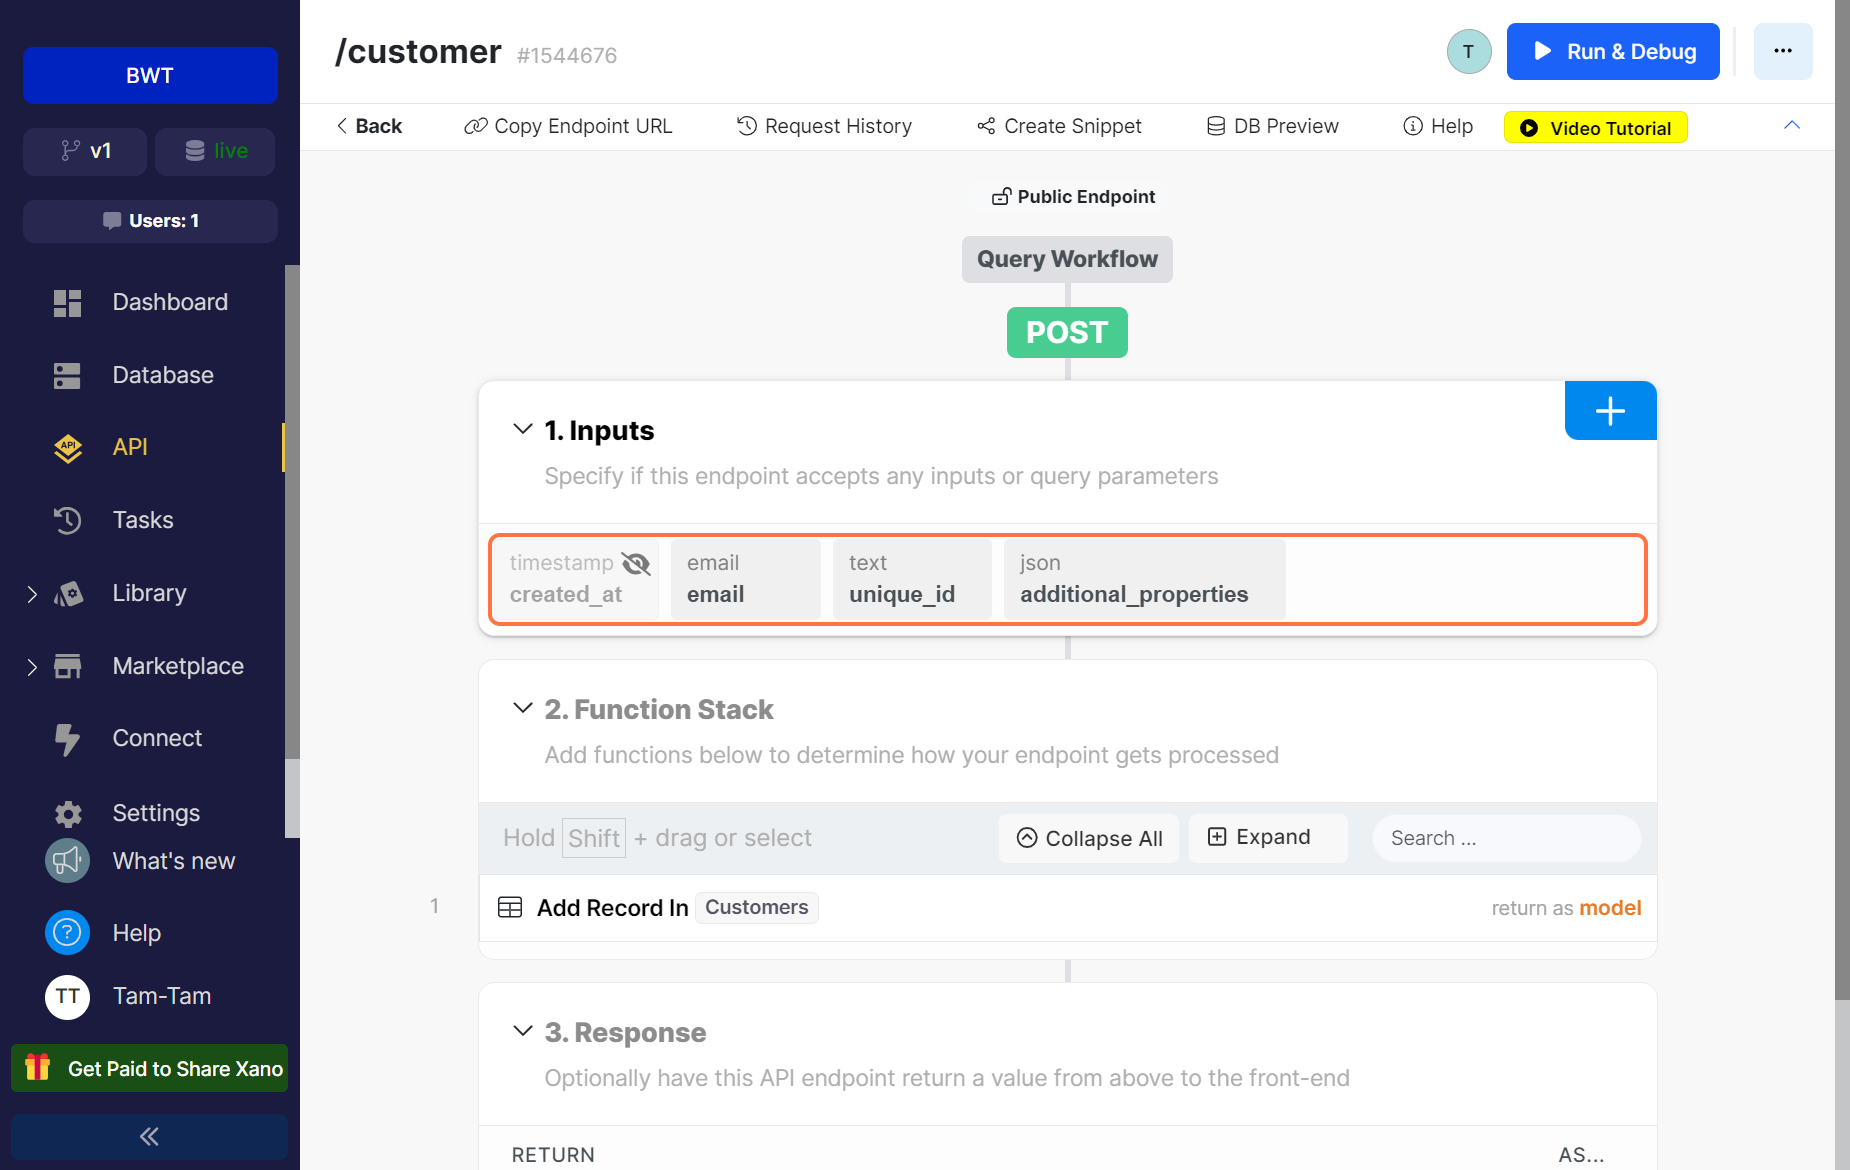
You’ll see that the inputs and function stack have been prefilled for you based on the properties in the Customers table and the operation that was selected. The created_at timestamp is hidden because the value will be automatically added depending on what the current time is, unlike the others where values have to be entered.
Let’s take a look at the function stack.
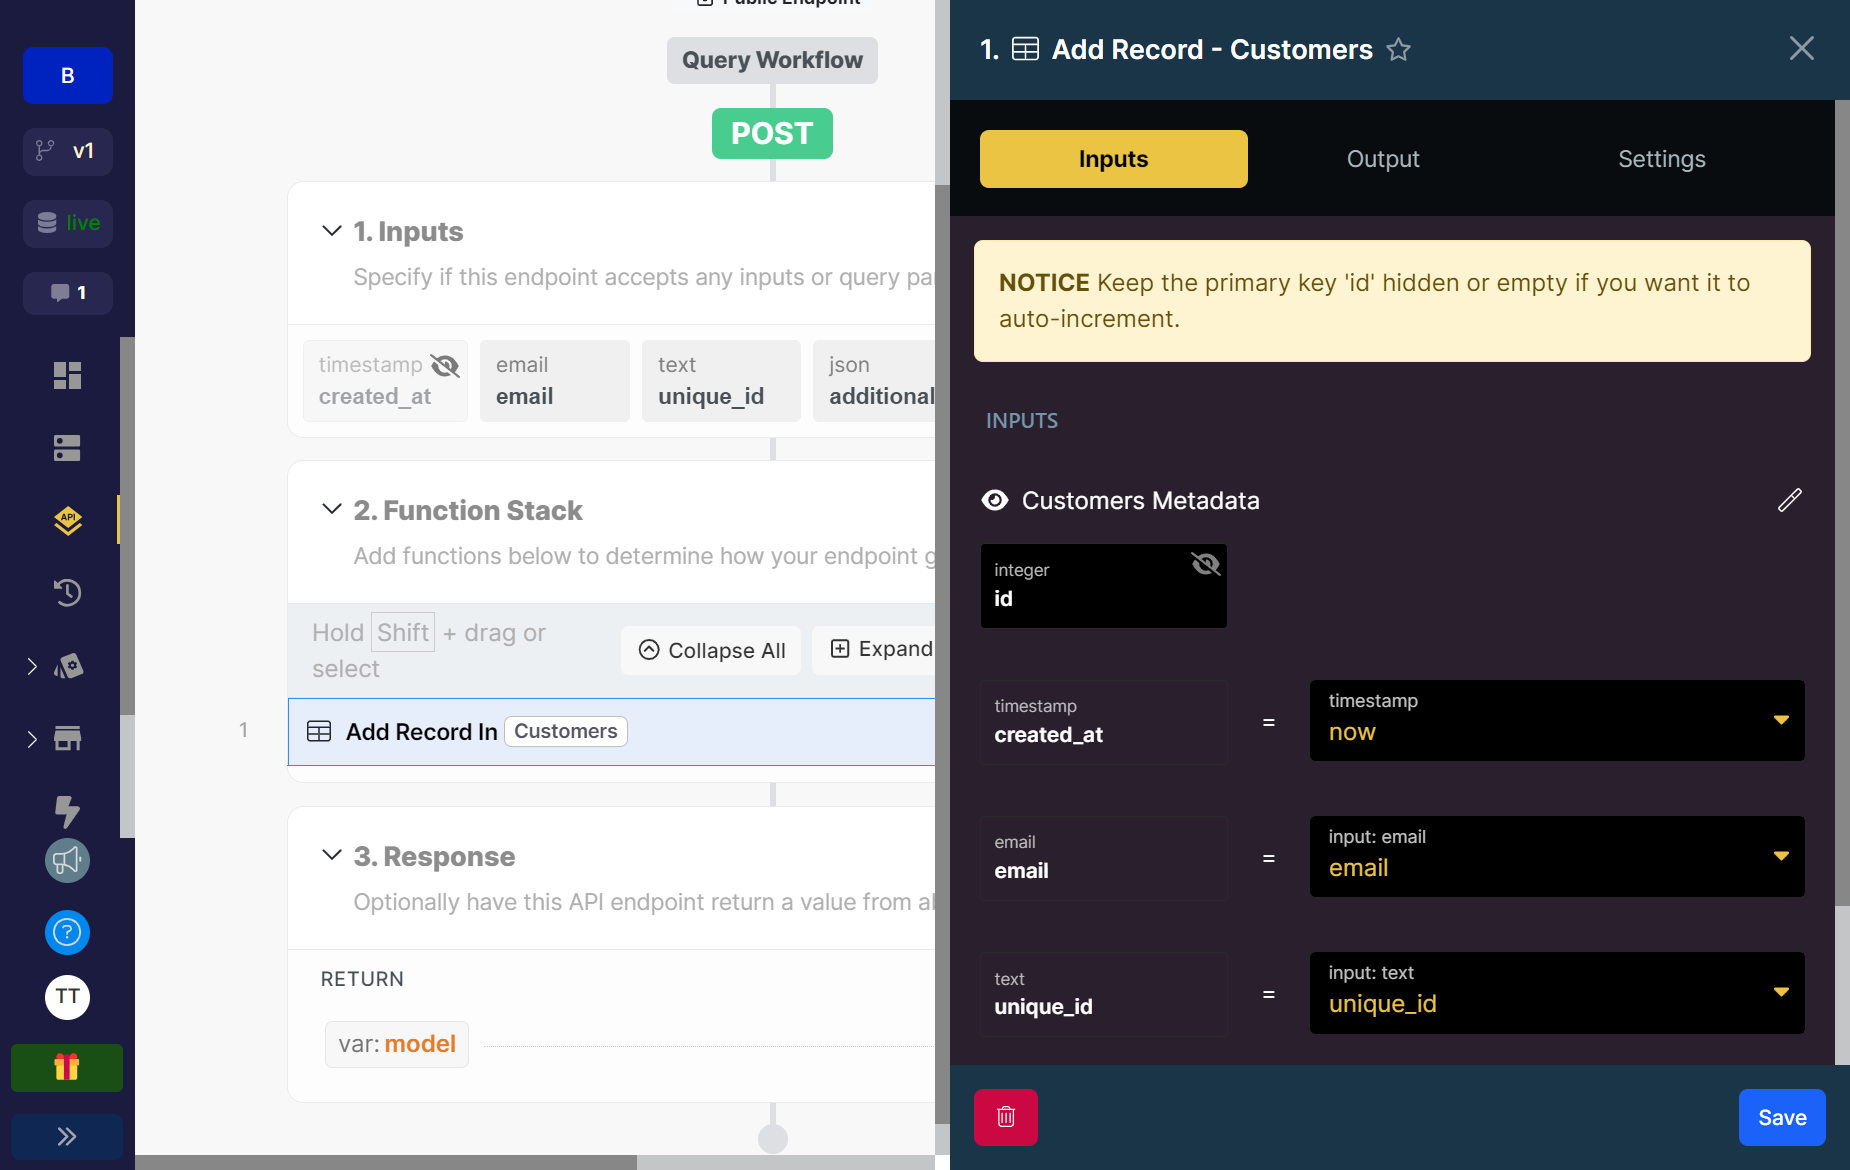
There’s just one function in the stack and it is to add a record. You can click on it to see that all the fields for the properties in our table have been prefilled correctly with the inputs of our endpoint. The created_at field has the now value which is used in Xano to capture an exact time.
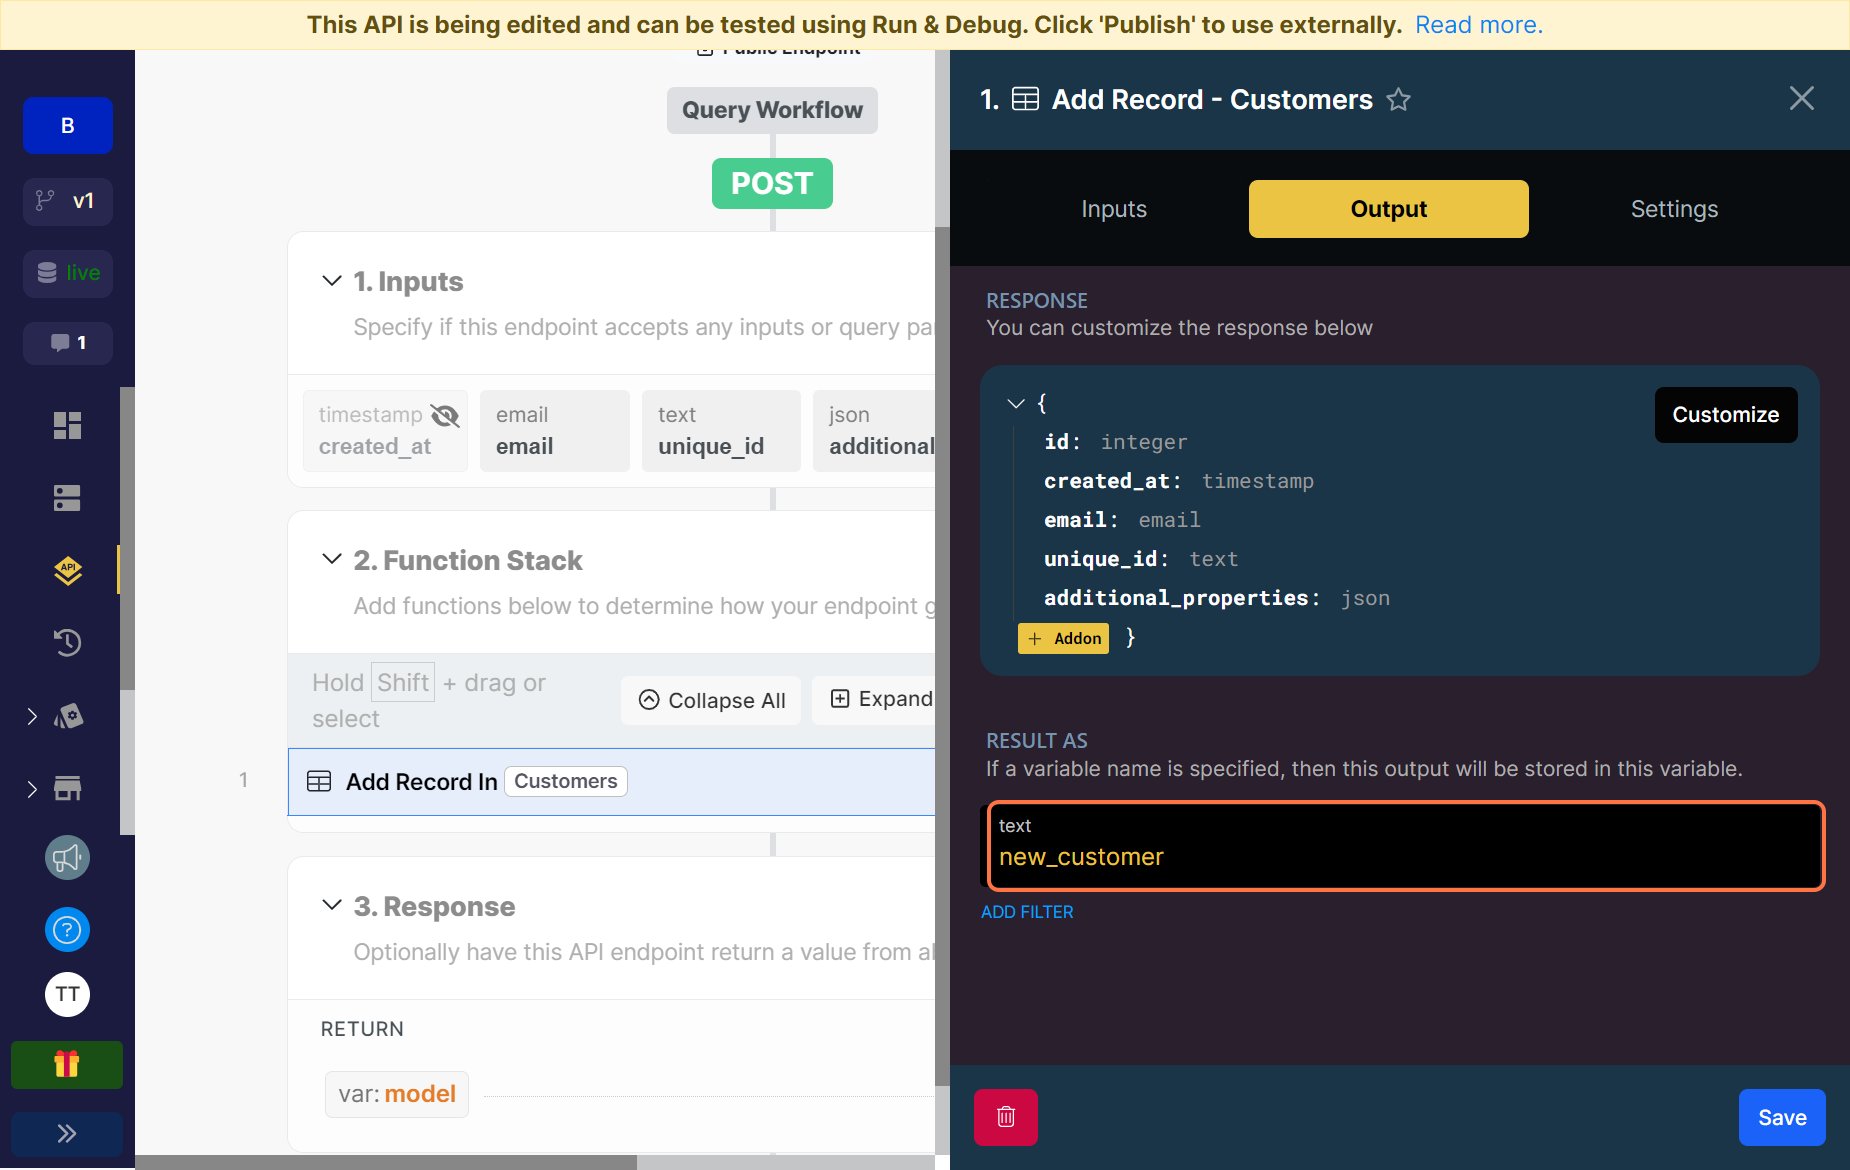
Click on Output to view the response for the function and rename the variable. The variable is where the output response of the function will be stored. You can choose to use this variable and its content in other functions in your stack so it’s always helpful to name it properly. We can call this new_customer because it creates a record for a new customer.
Finally, let’s take a look at the response for our endpoint.
When we run our endpoint with these inputs, what do we want it to return?
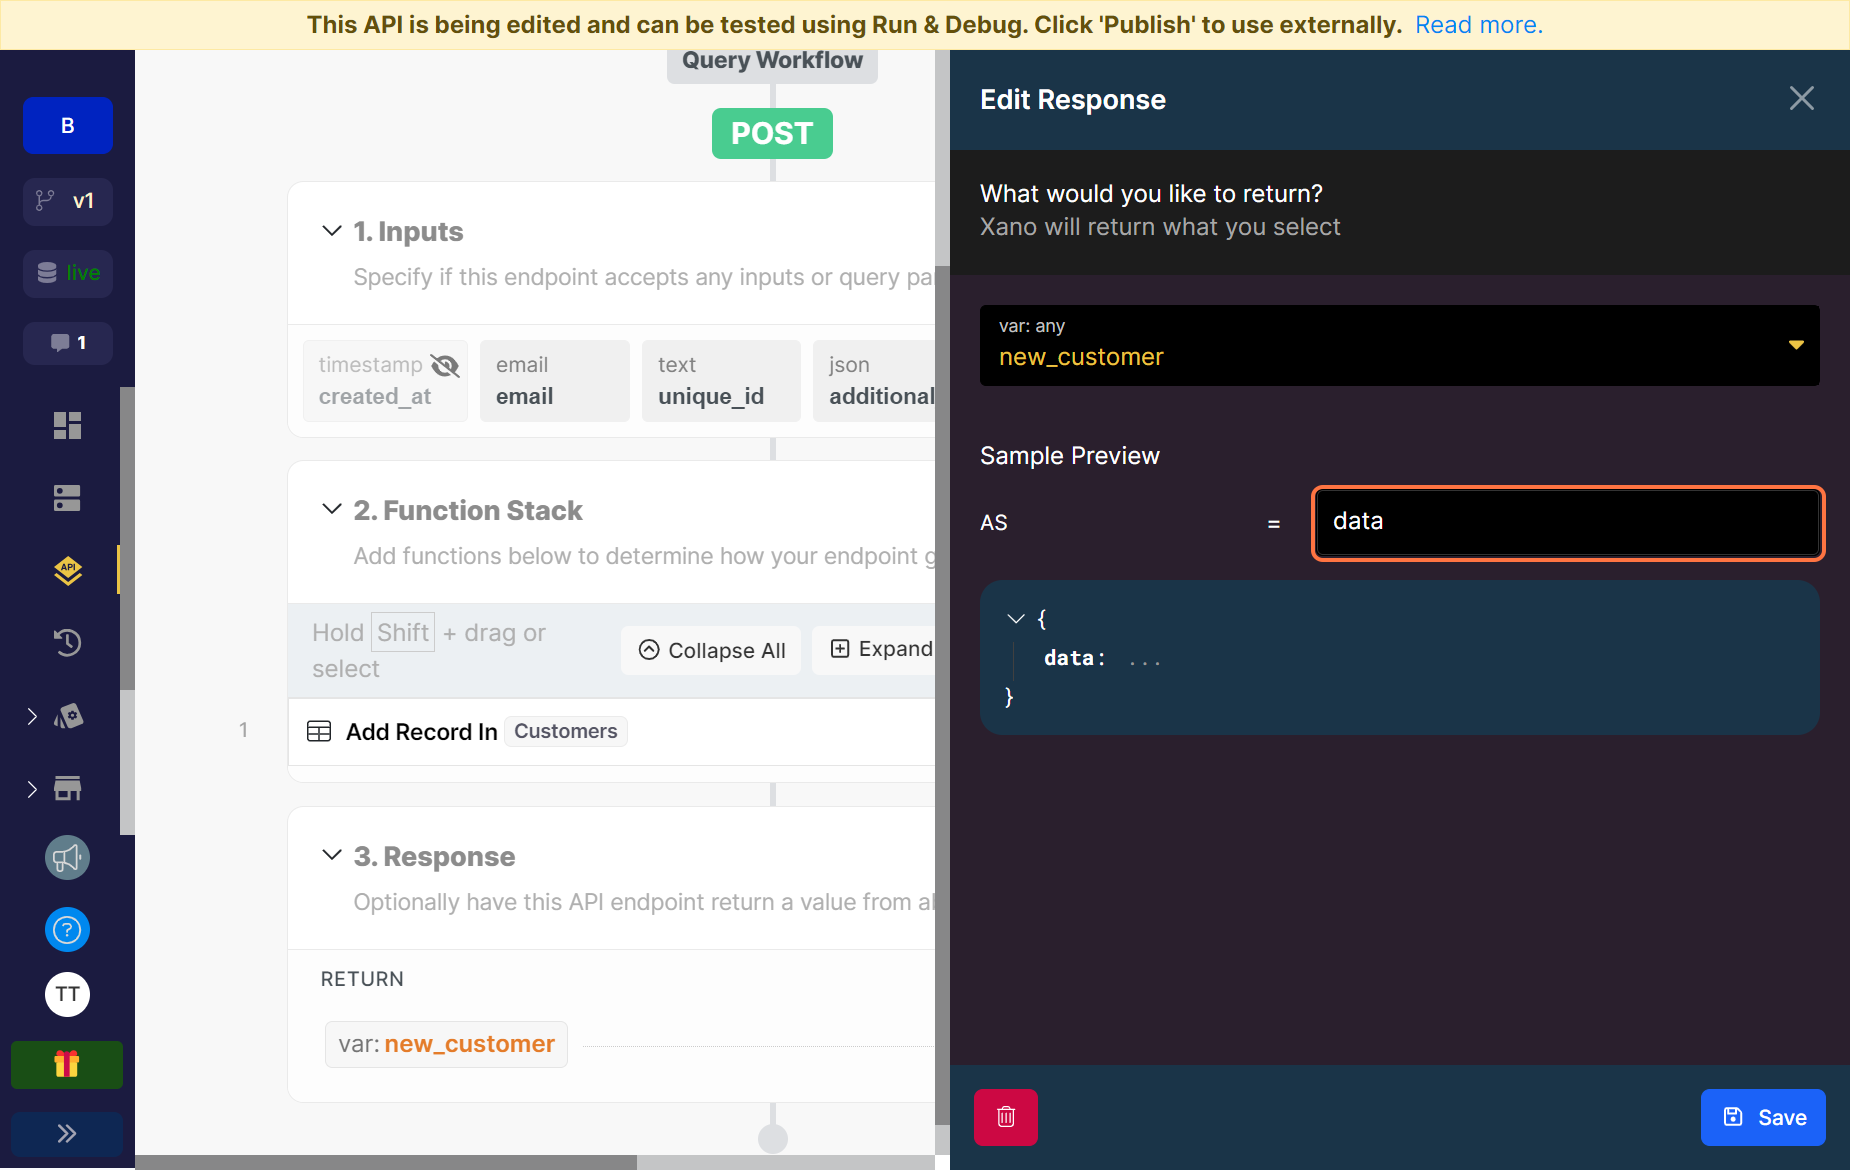
For a simple POST request like this, we would return the details of the new record just created. Those details are what happen to be stored in the output variable of our function. So simply click on the dropdown on top and search for the variable name new_customer.
You can also choose to give your response a name or leave it blank. Let’s call this one data.
Now let’s test our endpoint.
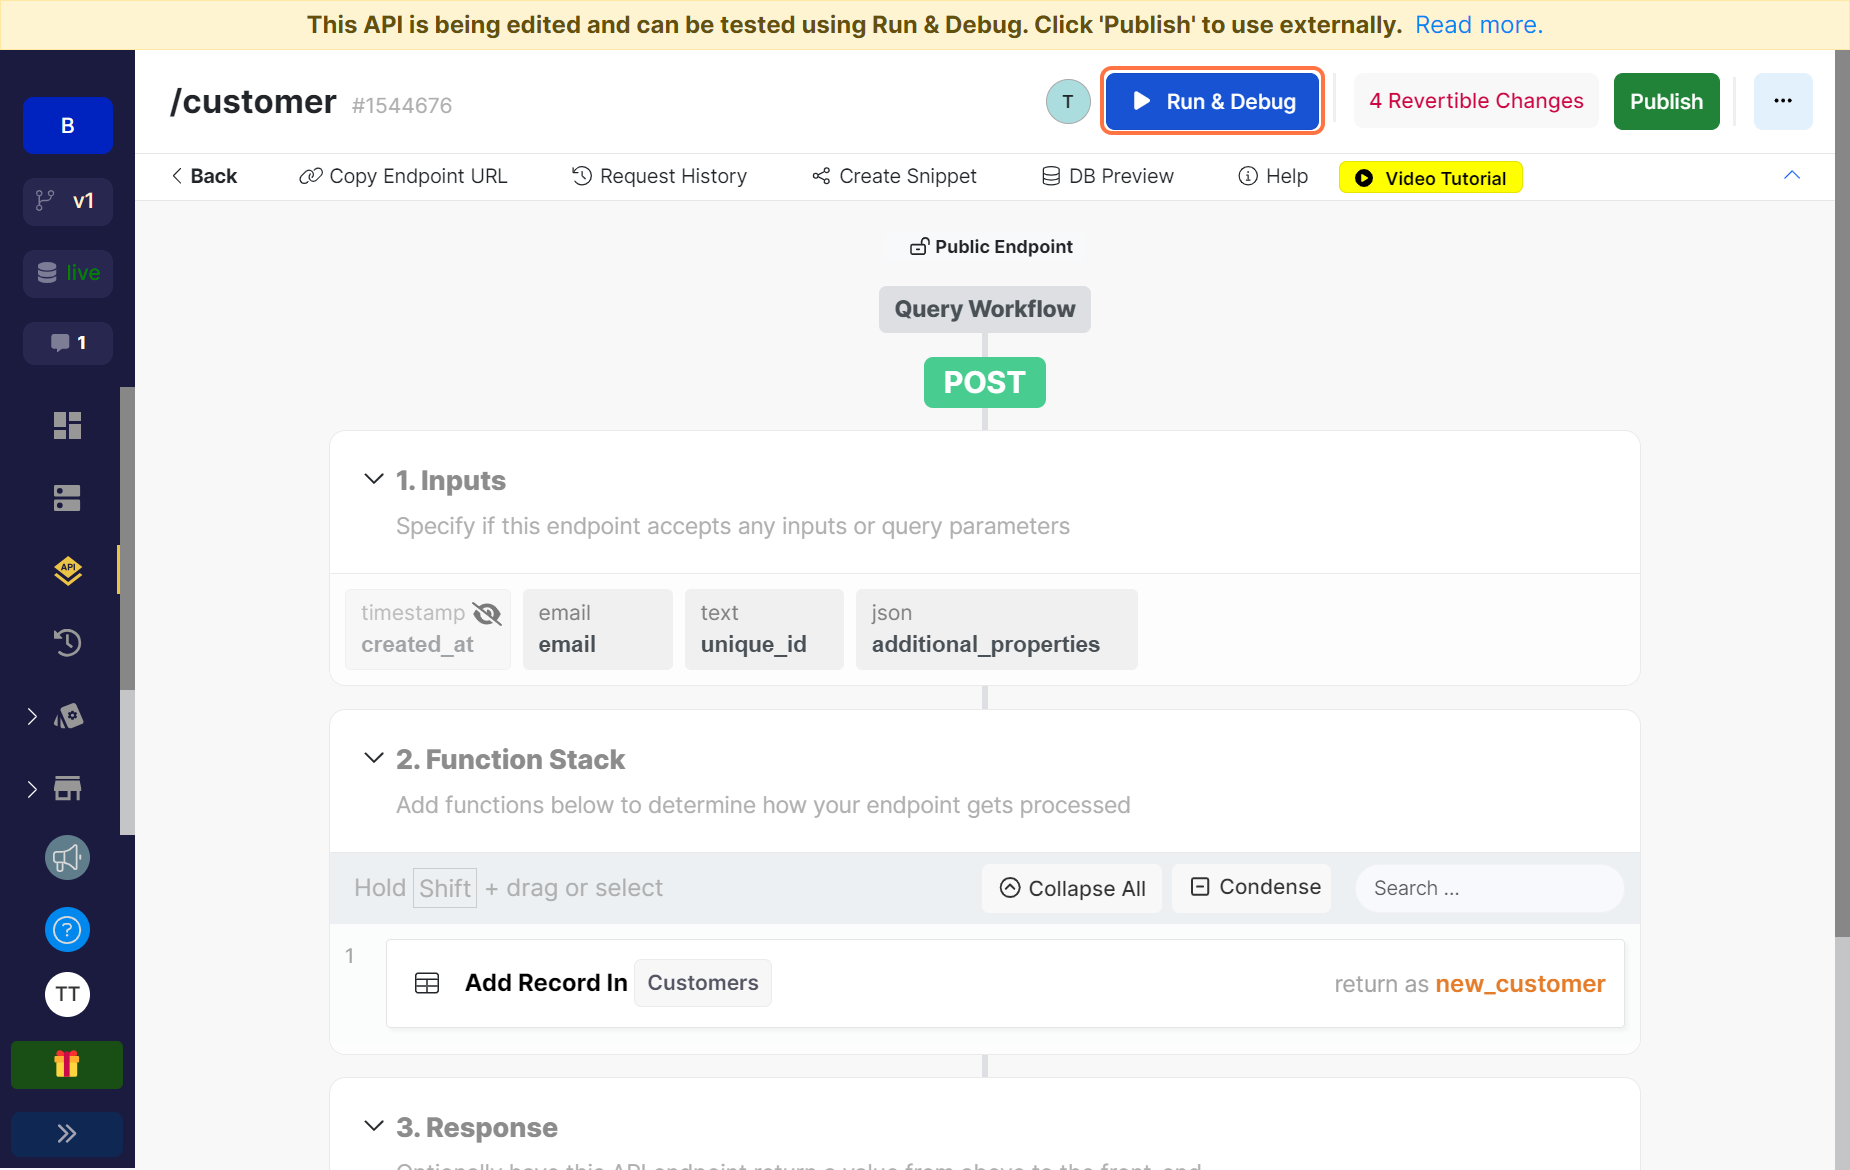
Click on Run & Debug at the top right of the page.
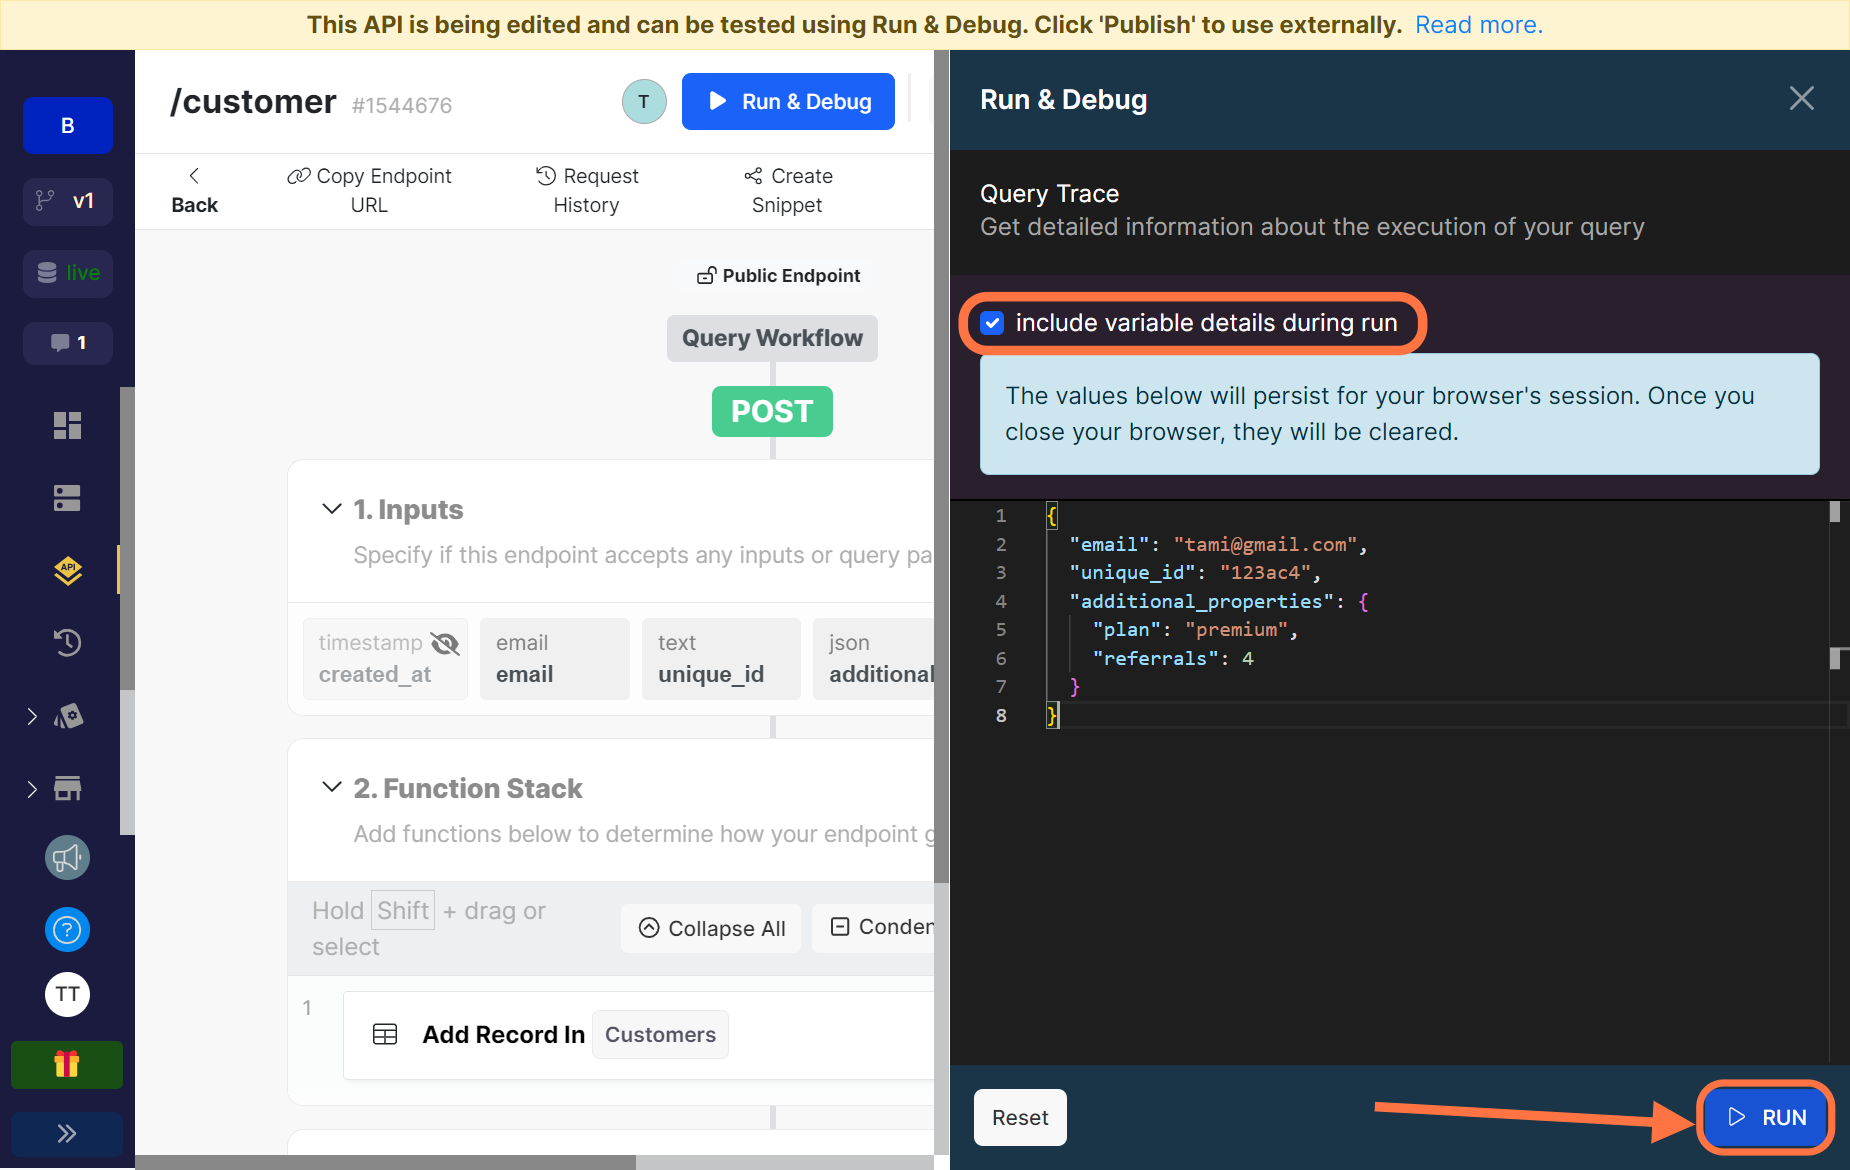
First, make sure that the check the box to include variable details during run to make debugging easier. It stores all the details of your API and allows you to see what is returned for every function in your stack when the API is run.
Next, enter your sample inputs for the API. The email and unique_id are text/string and required so they cannot be left blank. The additional_properties input is a JSON field, we didn’t set it as a required field so it can be left blank but let me add a little explanation for the field type.
The JSON field allows you to add any kind of unstructured JSON to any of your database records. This is the opposite of the Object field on Xano which requires the JSON to have a structure for all the records. So in this case, the additional_properties field is so you can add any extra information about your customers. For our example above, we used a JSON with plan and referral keys. In another request we could have a JSON with name and amount keys.
Lastly, click on RUN. If you need to start all over, you can hit the Reset button.
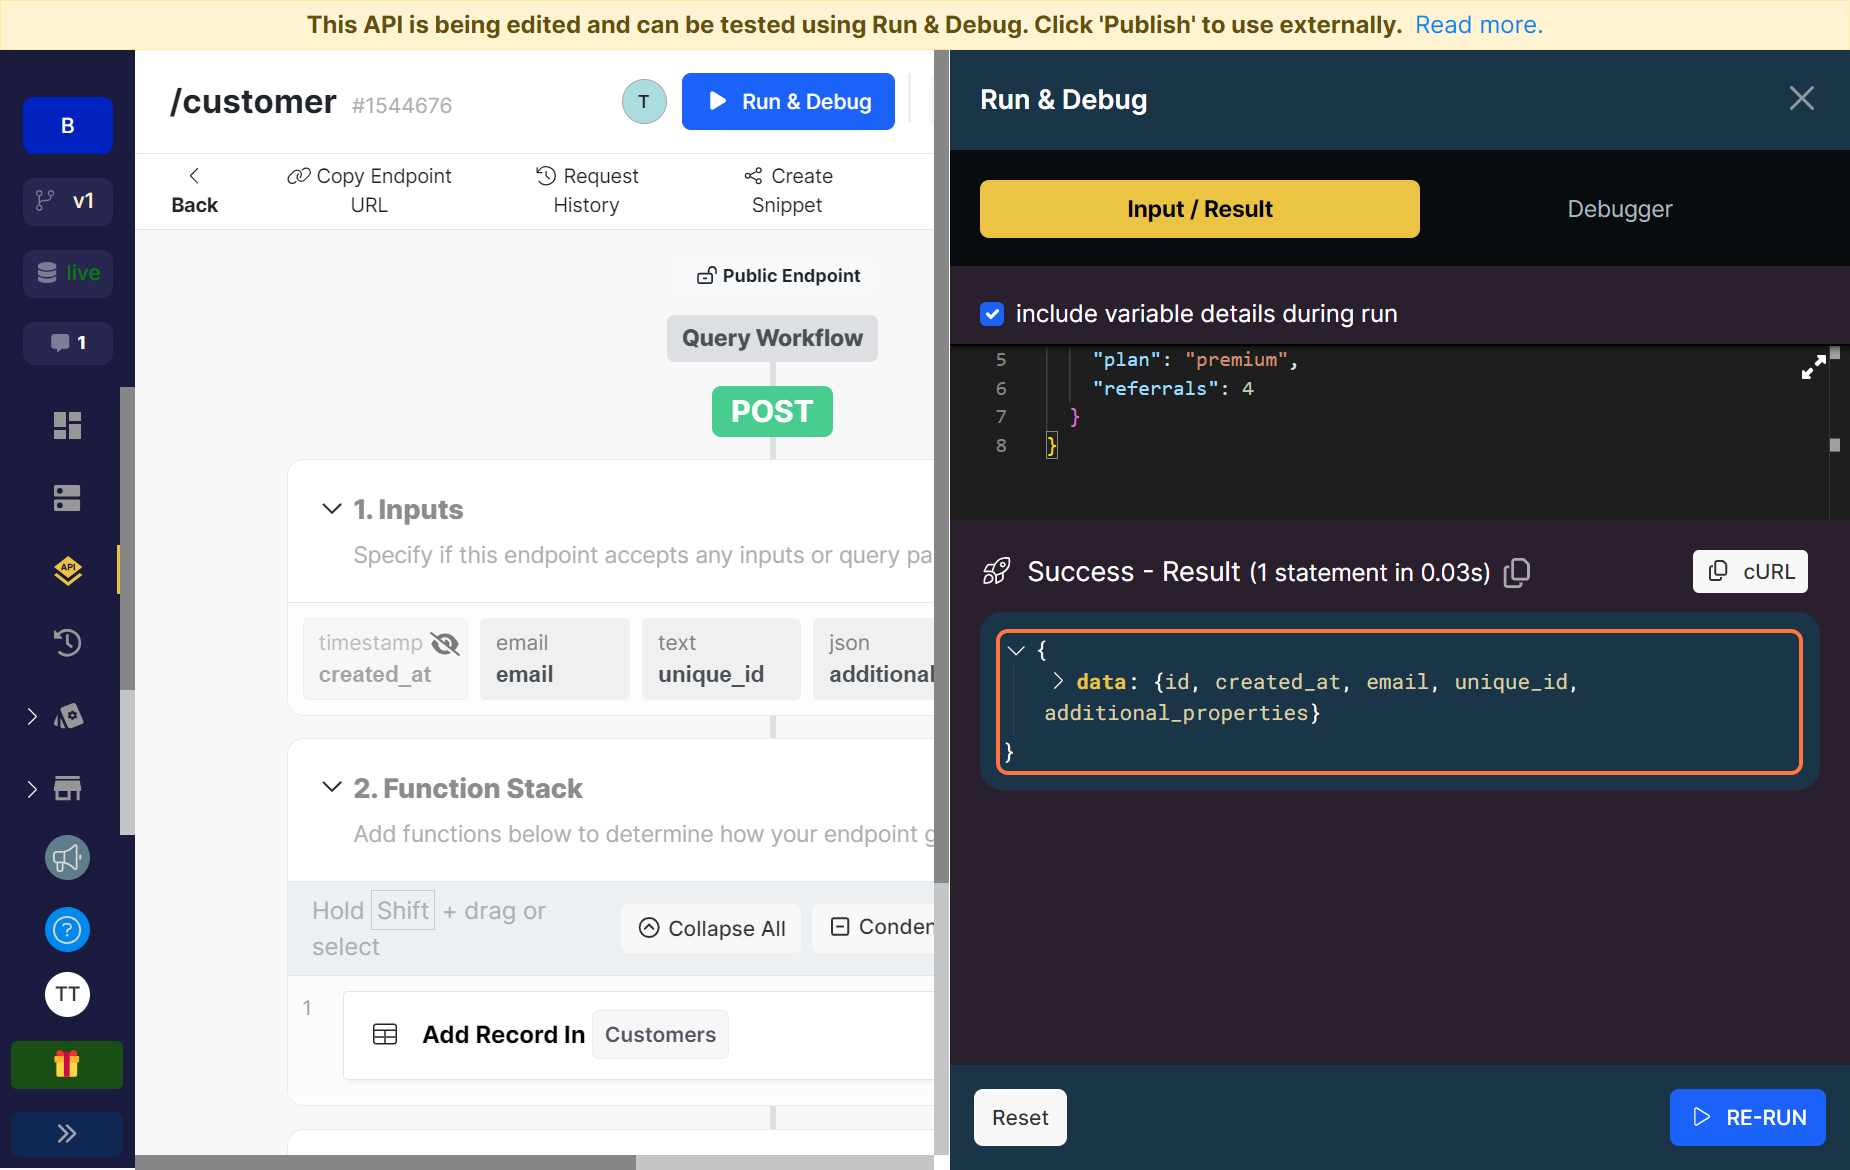
If the request is successful, you’ll see the Success text and the result. Here we have our response which we labelled data.
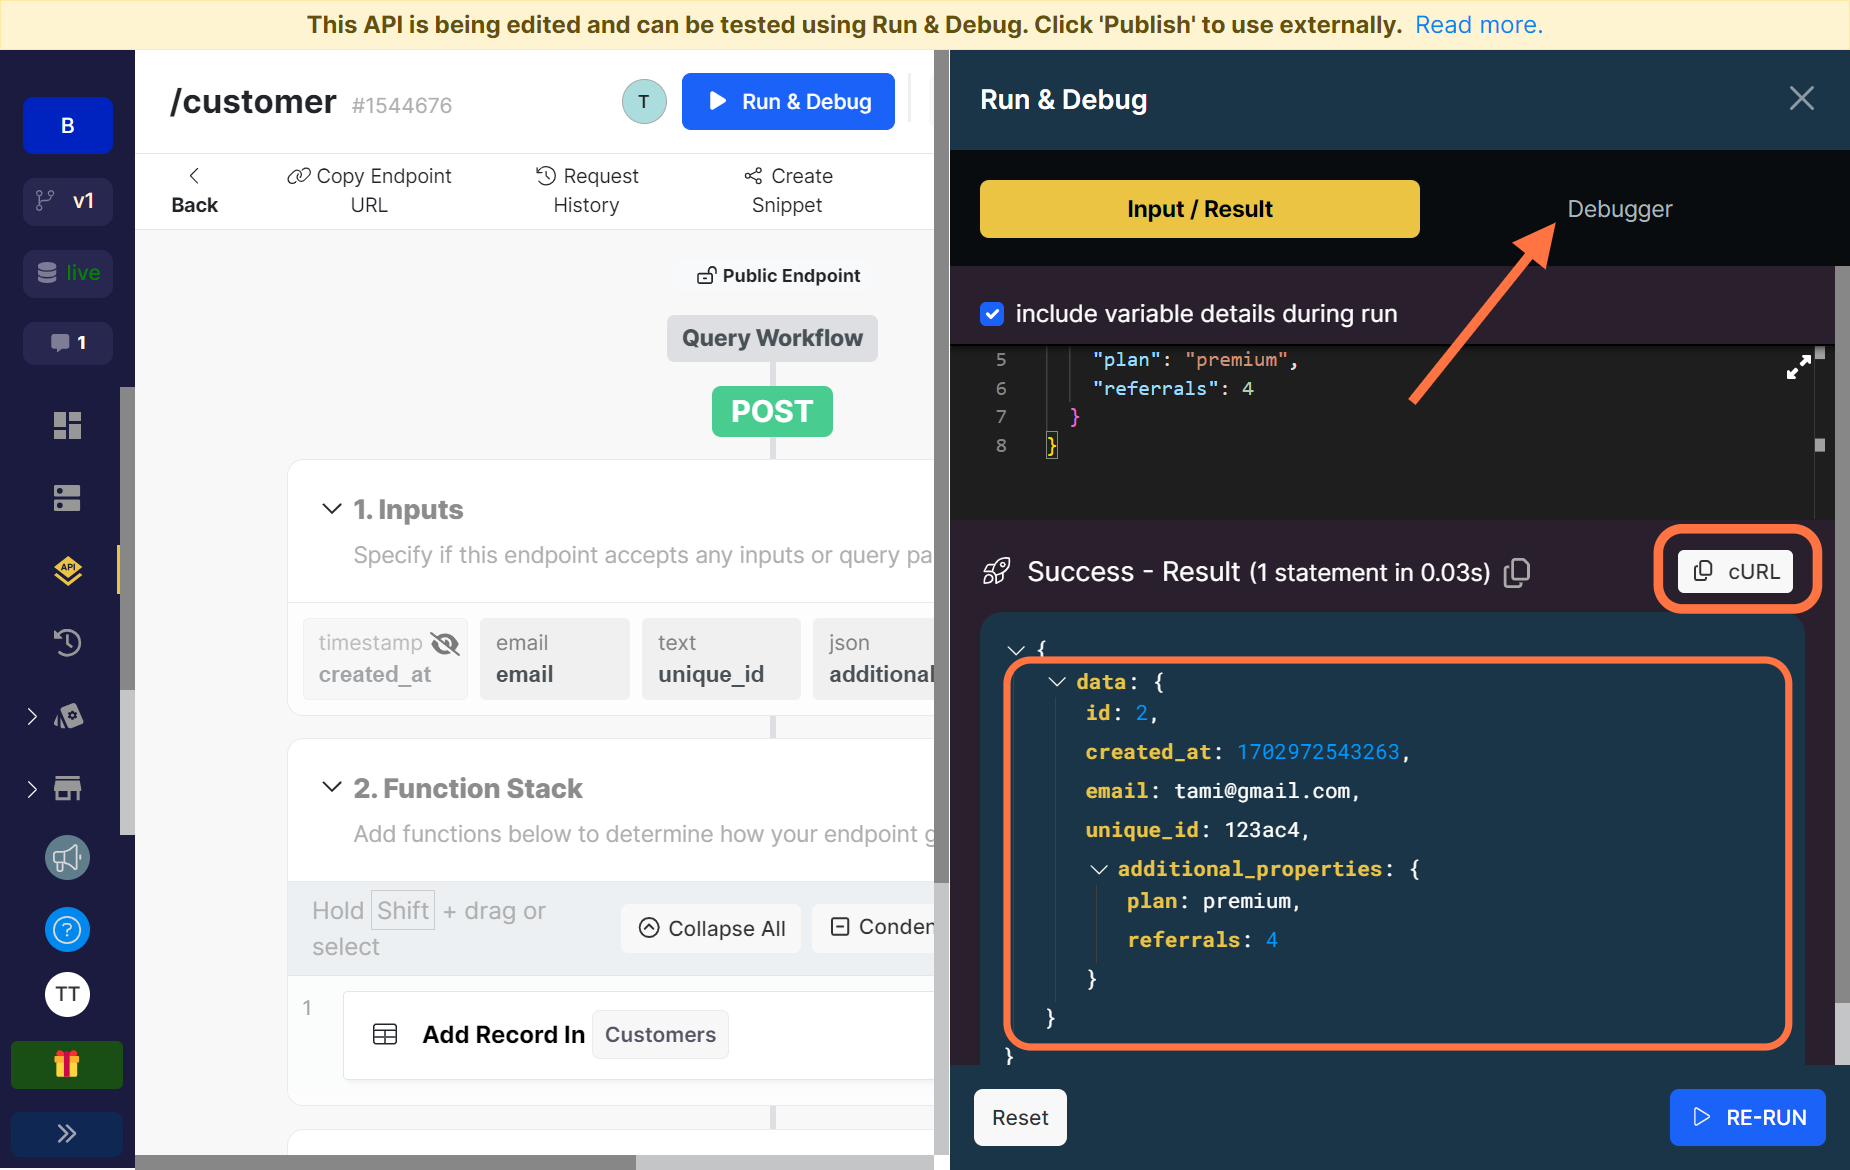
If you toggle on it, you’ll see the full result and details of our newly created customer. If you want to debug and look at the results of each function, you can use the Debugger. You can also copy the cURL and re-run the request.
You can read more about Xano’s API debugger here.
🔔 To make this simple and short, I didn’t add a function to check if a customer already exists or one to create UUIDs that can be used to prefill the
unique_idfield. However, I include more detailed steps of builds in my newsletters, you can subscribe here to get them.
Create a new metric
Follow the steps we took for the create customer endpoint here as well.
Add a new CRUD operation endpoint, select the Metrics table and the POST operation. Note that the default value for the total_number_of_events property should always be 0. This field is how we keep track of how many events have been logged for a particular metric and at the point of creating a new metric, the total number of events for it is zero.
Don’t forget to test and debug.
Ingest an event
The last endpoint we need for our Ingestion API is the one to log the events when a customer takes an action.
For this, we’ll pick the option to start from scratch.
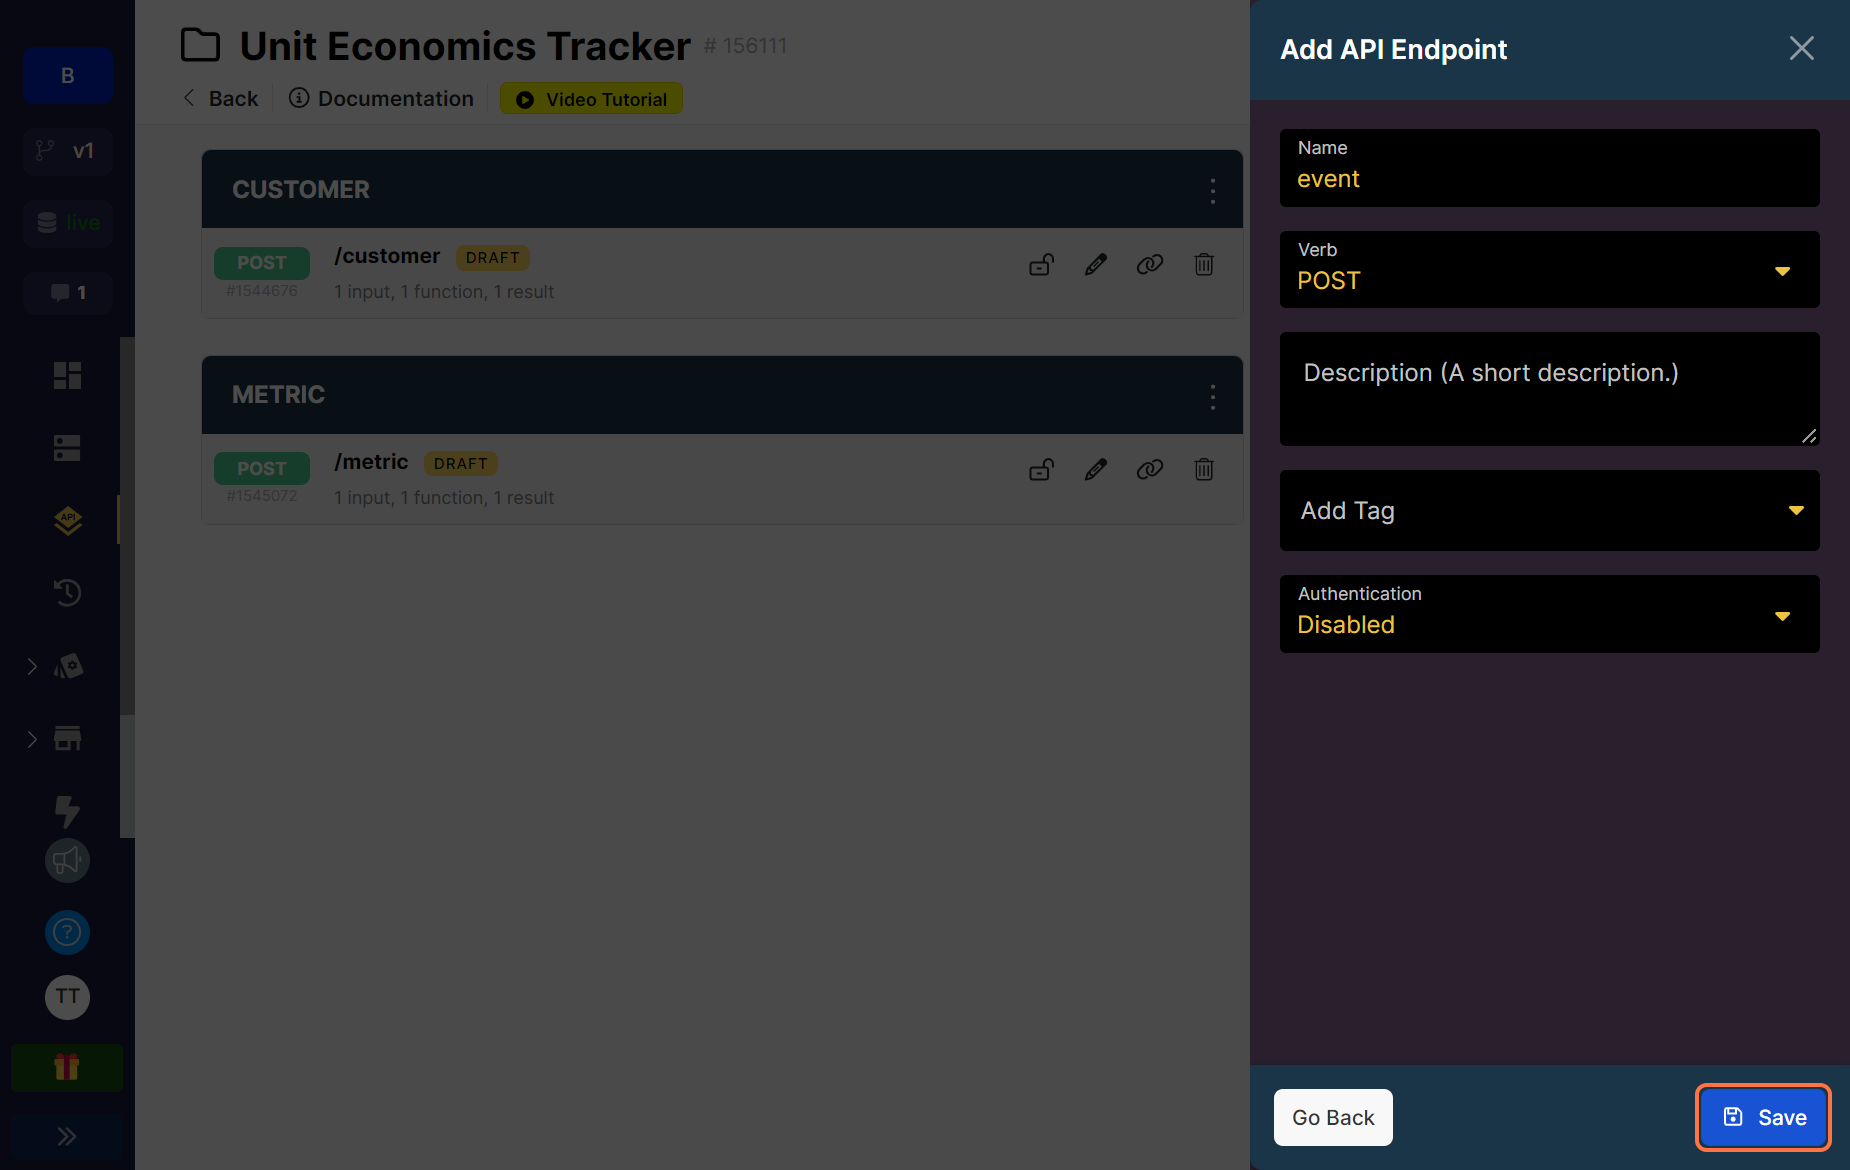
Give the endpoint a name, in this case it’s called event, set the Verb to POST and save.
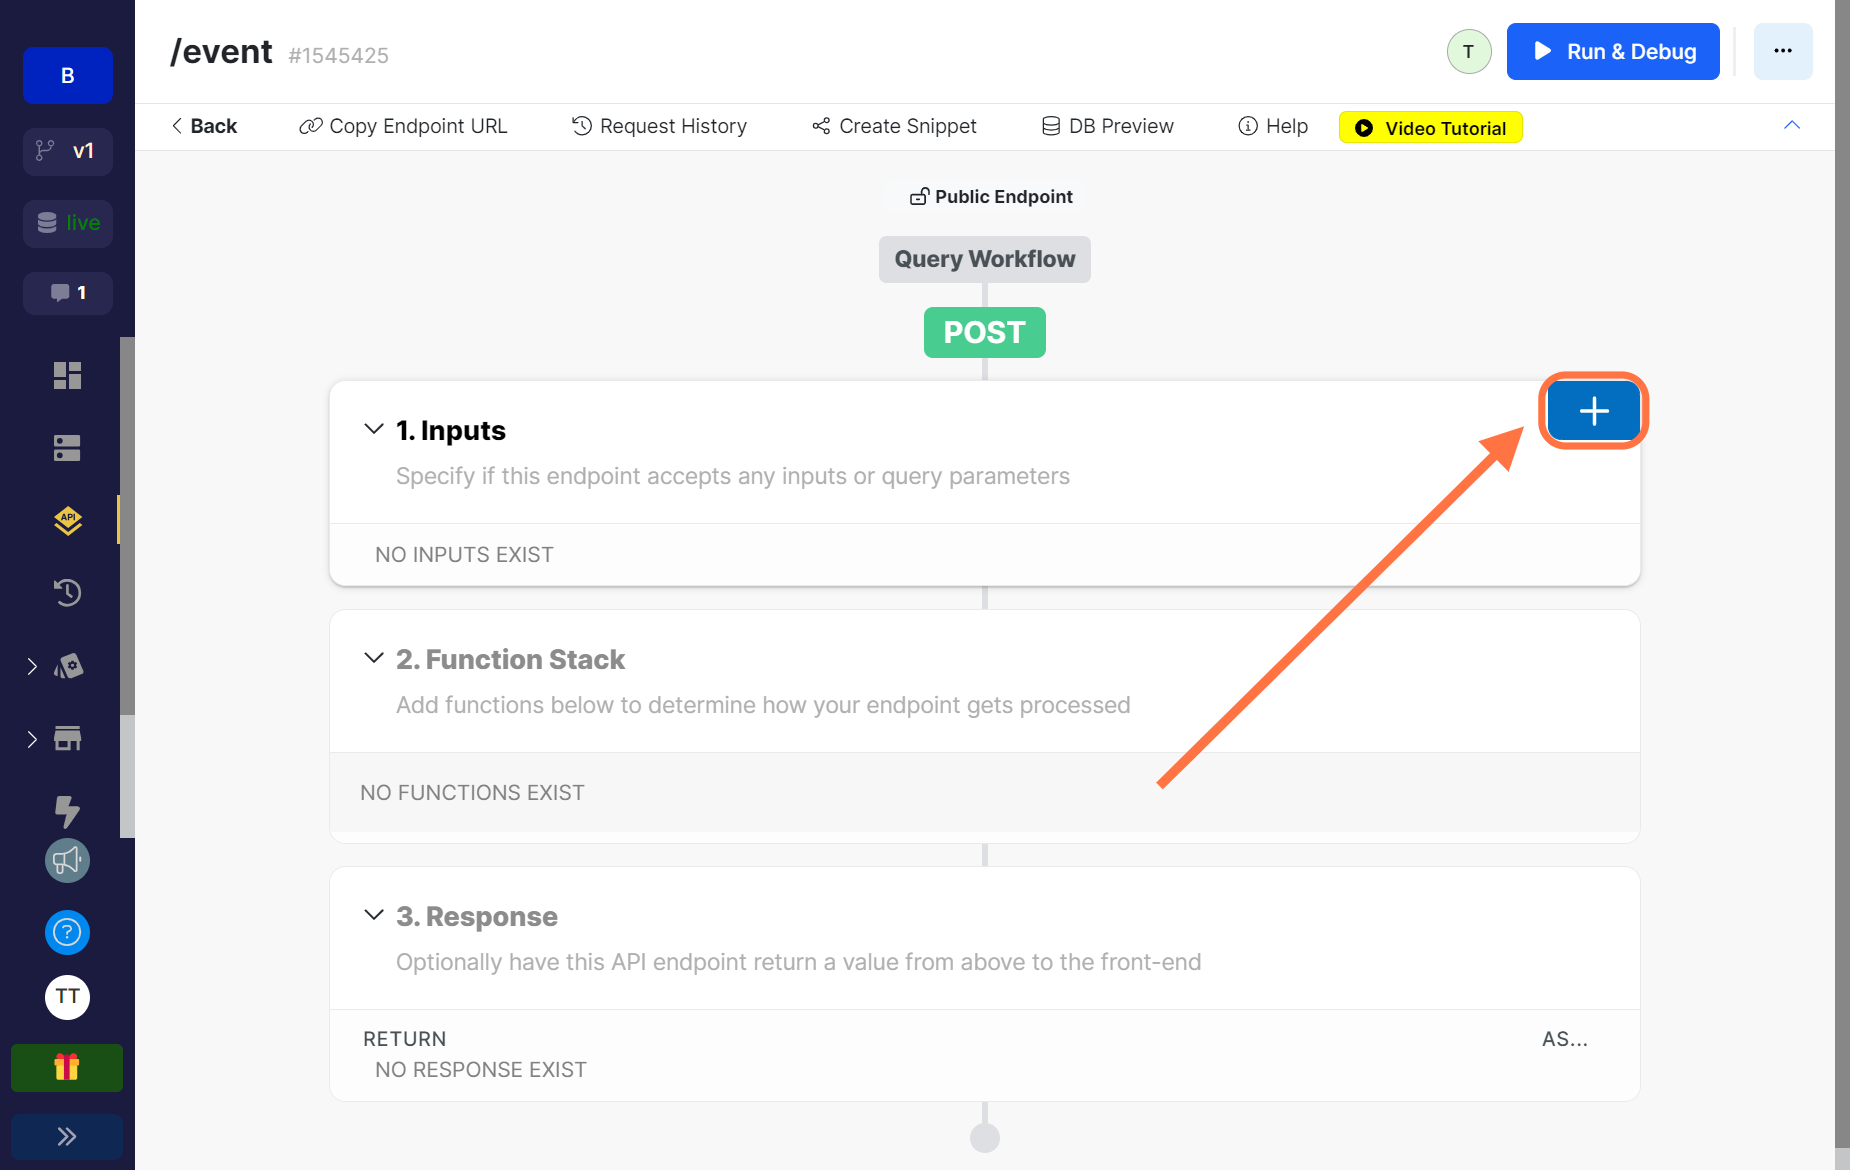
Next, let’s add inputs needed for our endpoint. Remember, this endpoint is to log the events as they happen so most of the inputs will be the same as we have in our Events table. Click on the plus icon as seen in the image above to see the list of field types that can be used for our inputs.
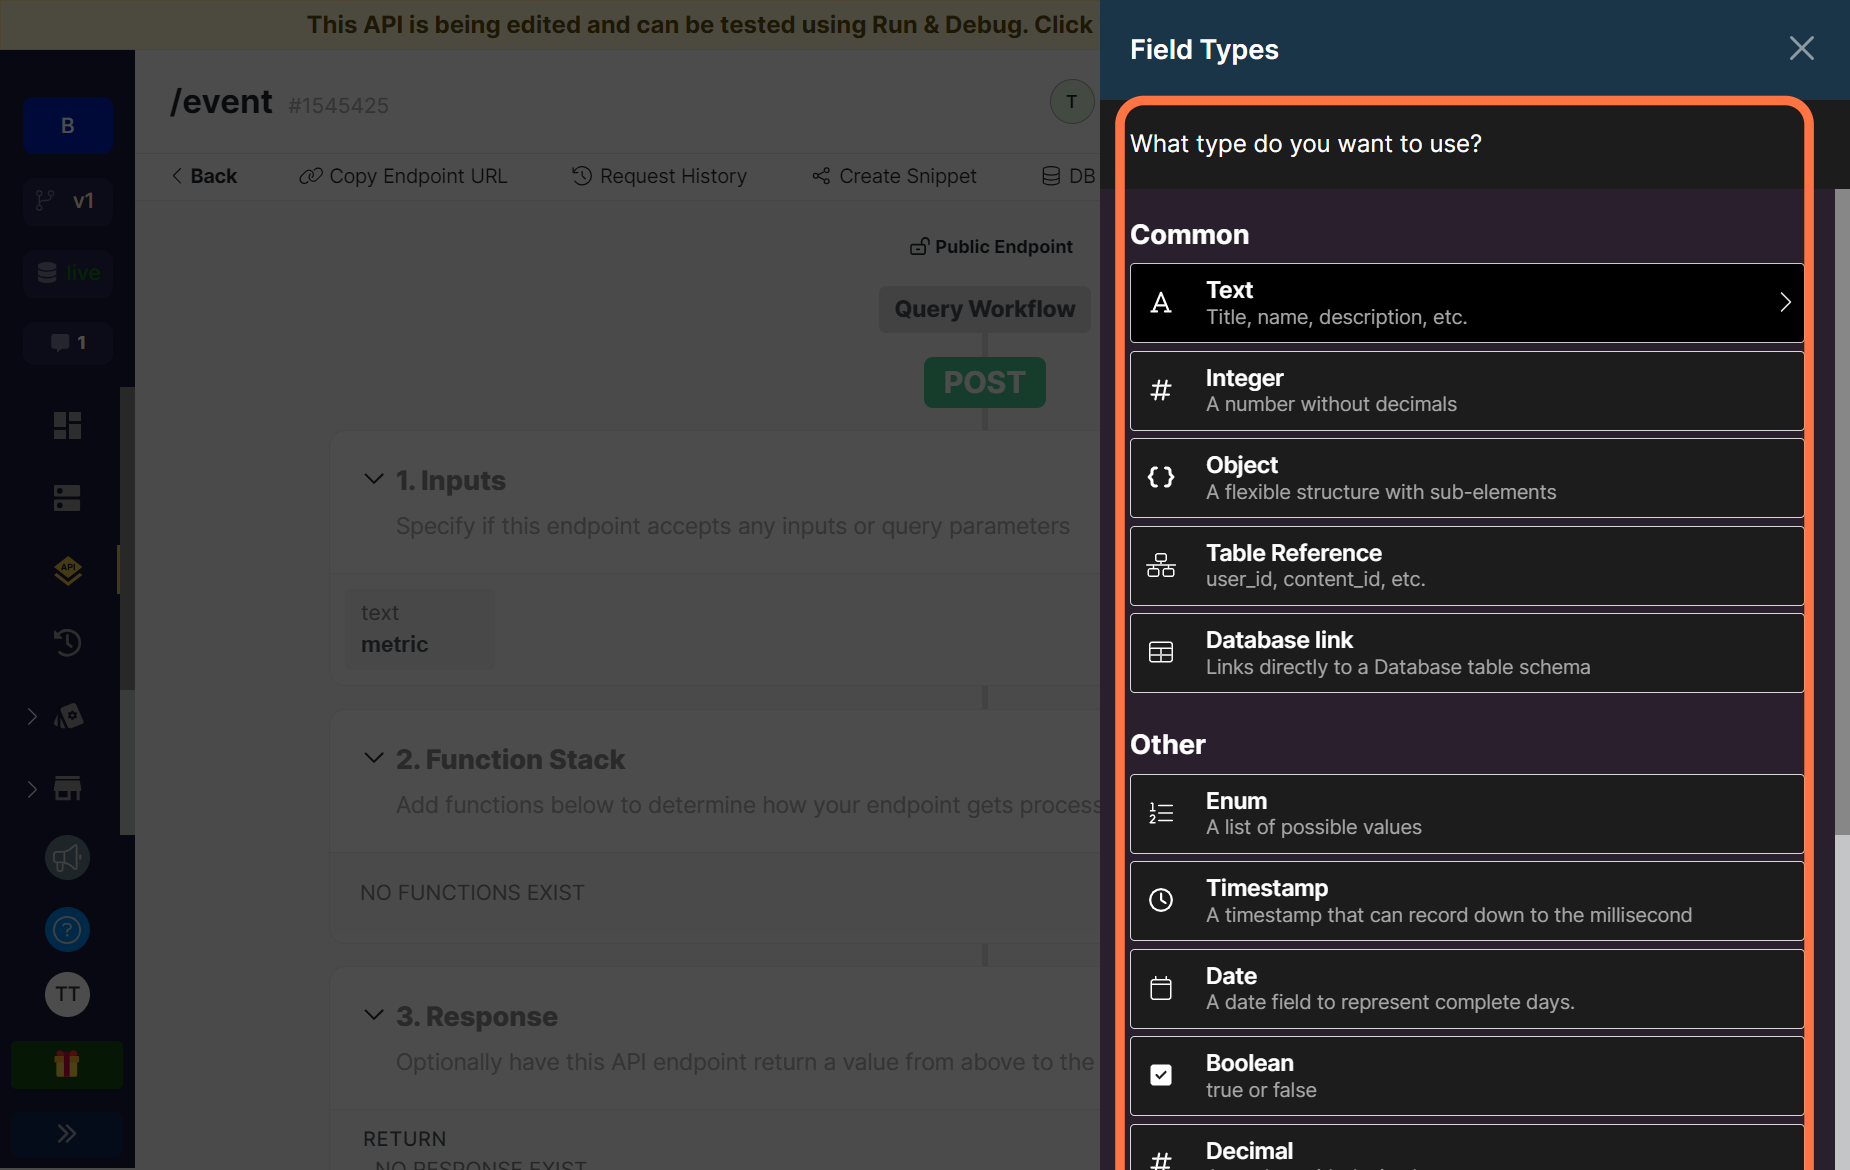
These are the inputs we need:
| Input | Field Type | Description | Required? |
|---|---|---|---|
metric | Text | The name of the metric for the action being logged | Yes |
unique_id | Text | A unique id for the logged event | Yes |
value | Integer | The value of the metric tracked | Yes |
customer_email | Text | The email of the customer who takes the action | Yes |
Before we move on to the function stack, there are some things to note about the value input.
The value field should generally hold the calculated amount attributed to that action or metric. For example, in our previous example where a customer of Zee makes a deposit of N300,000 into their fixed savings account, this would have cost Zee 1.4% of the deposited amount which is 4200 and also made them 2% which is 6000.
There would be two events logged in this case and the value field would hold 4200 for the processing_fee metric and 6000 for the interest_earned metric.
However, in cases where the action being assigned value is something like the minutes a customer spends talking to support staff, the actual amount of the cost for each event can only be determined by dividing the cost of the tool by the total number of minutes that have been spent by customers over a particular period of time and this is constantly changing.
We’ll look into how to handle the dynamic calculations when we are building the Analytics API but here you should just enter the actual number of minutes as the value.
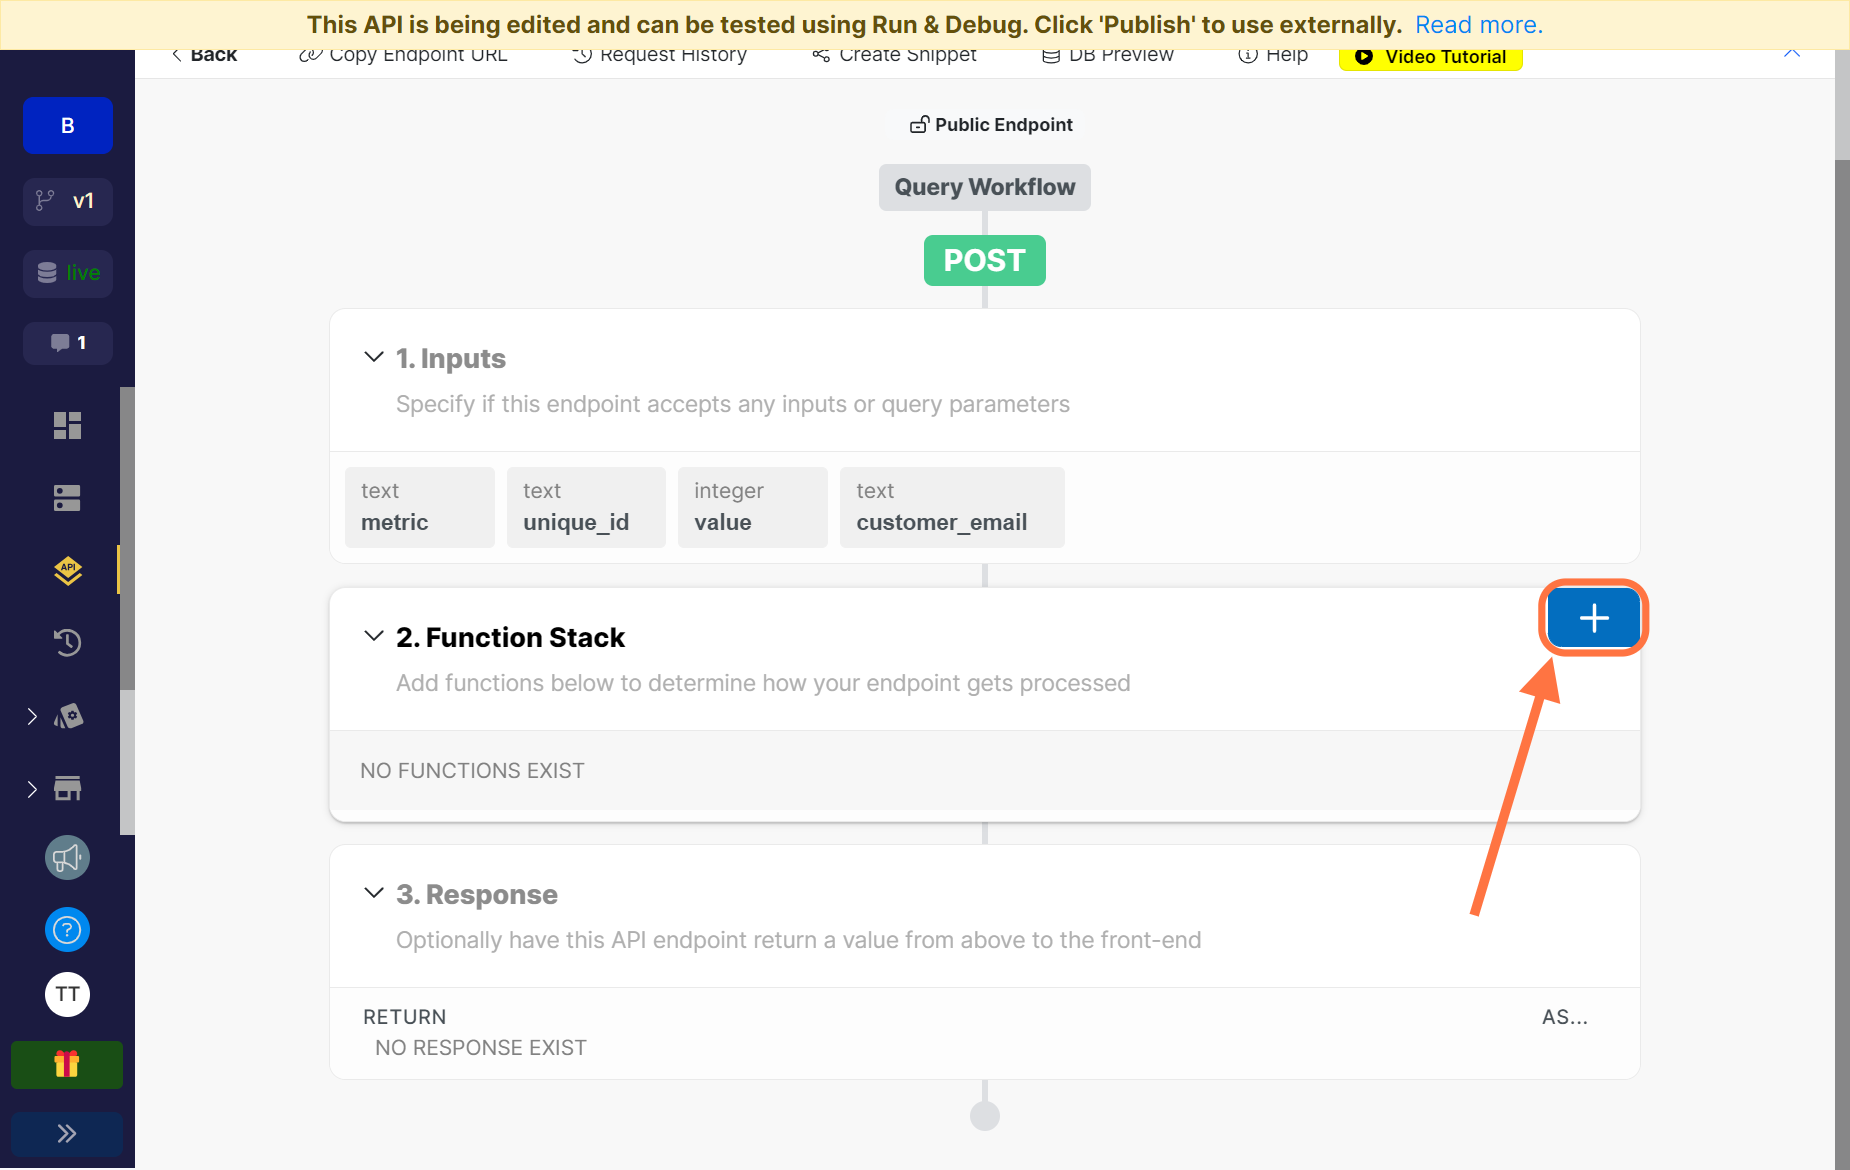
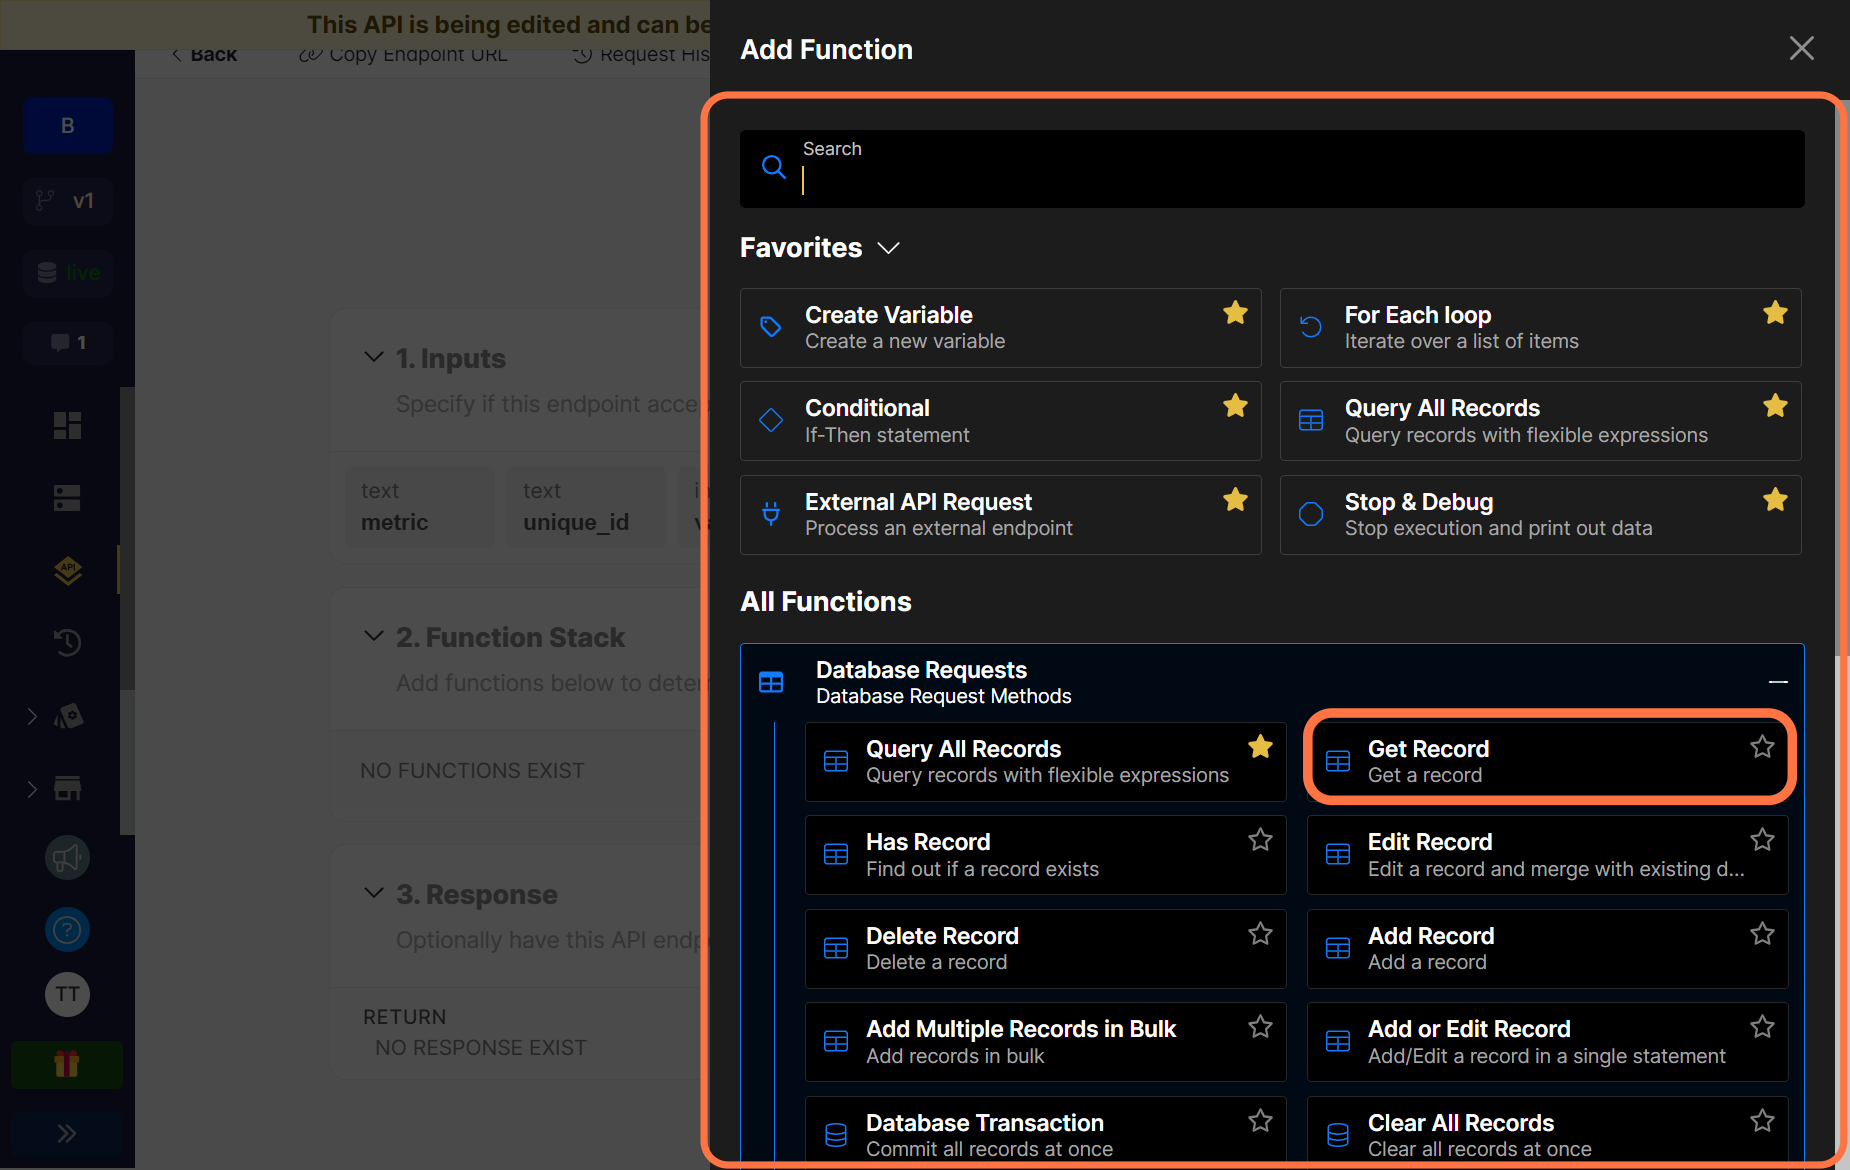
Let’s start working on our function stack. Click on the plus icon at the right side and the list of all available functions will be displayed.
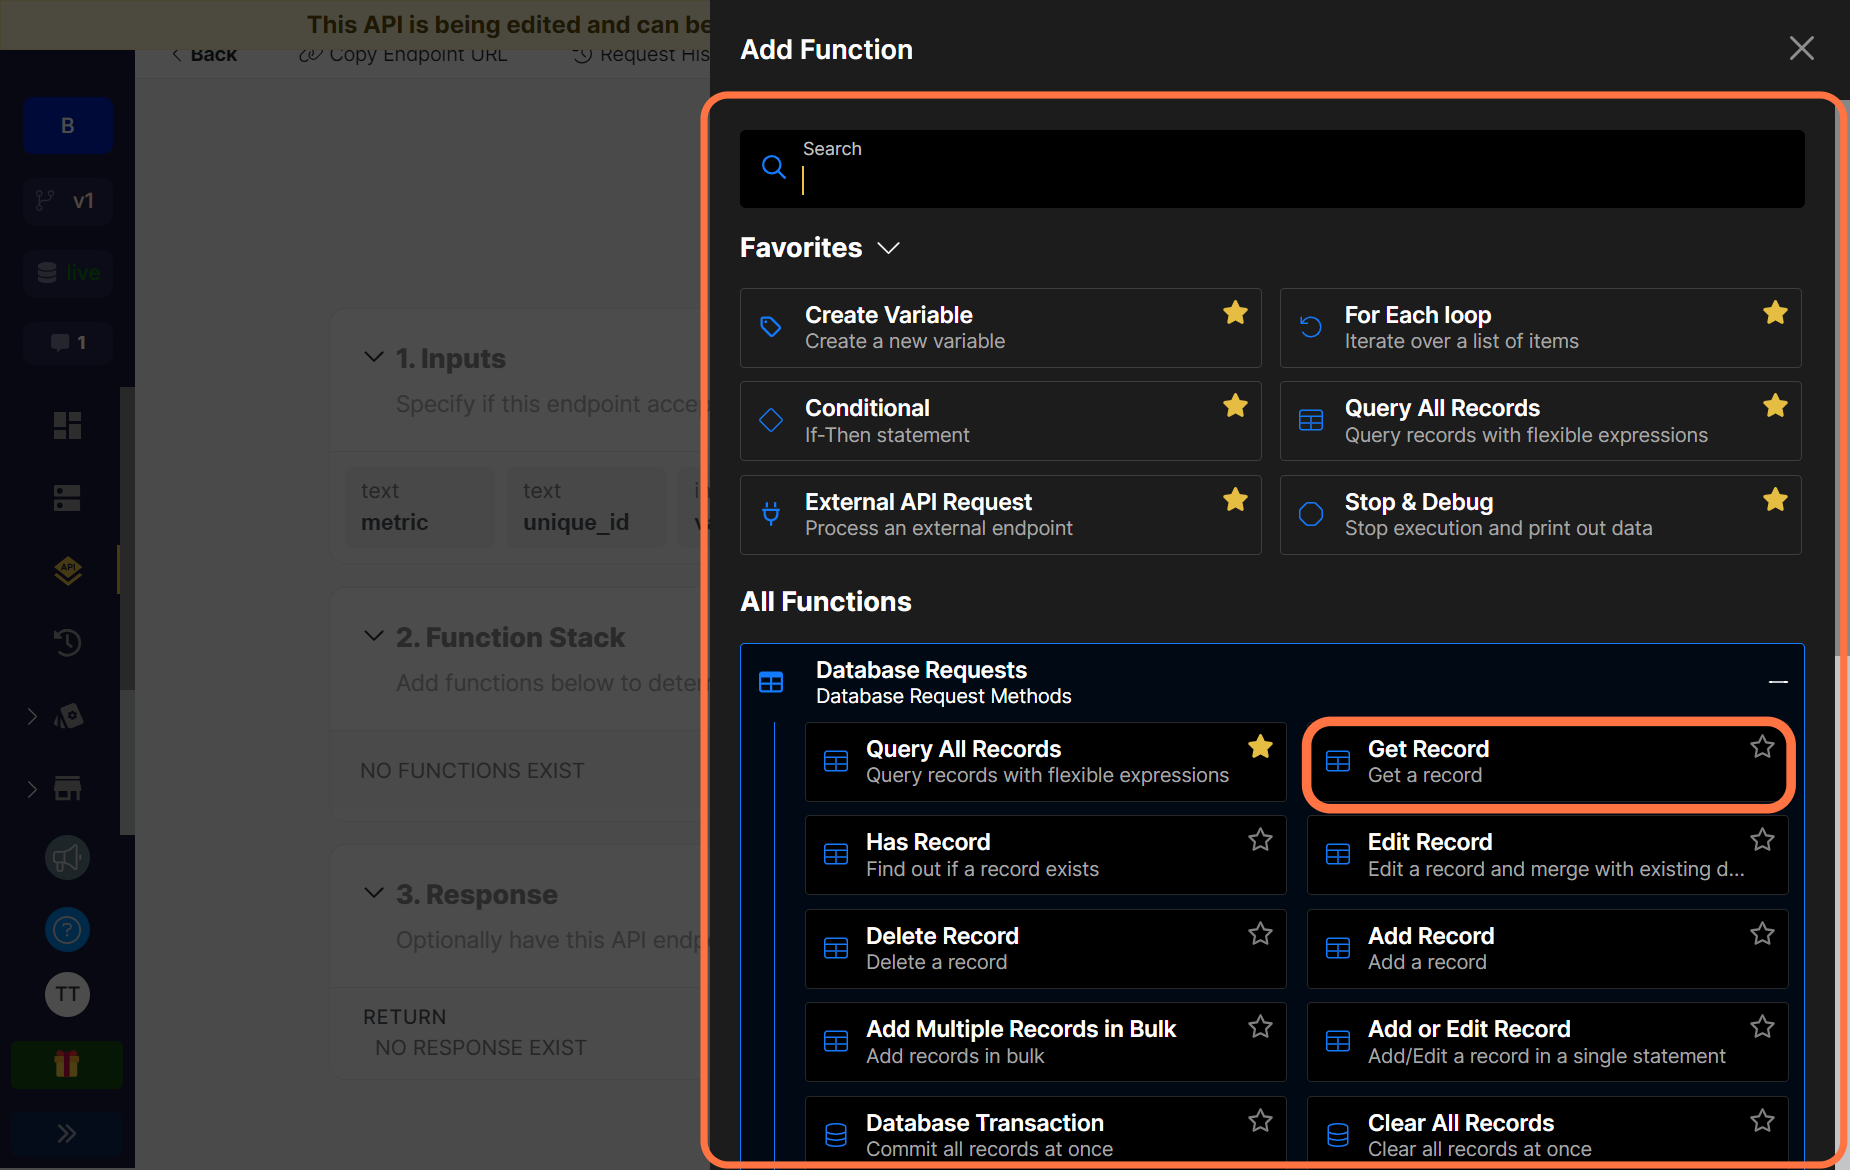
Our first function is to get the Xano id of the customer who takes the action of the event being logged. We need this id because our Events table has the customer column referencing the Customers table, this way every event logged is linked to a customer recorded in the Customers Table. And the only value allowed for that field type is the original id that Xano gives when you create a record.
First, click on Database Requests. This reveals all functions under that category, one of which is the Get Record function which is what we are going to be working with.
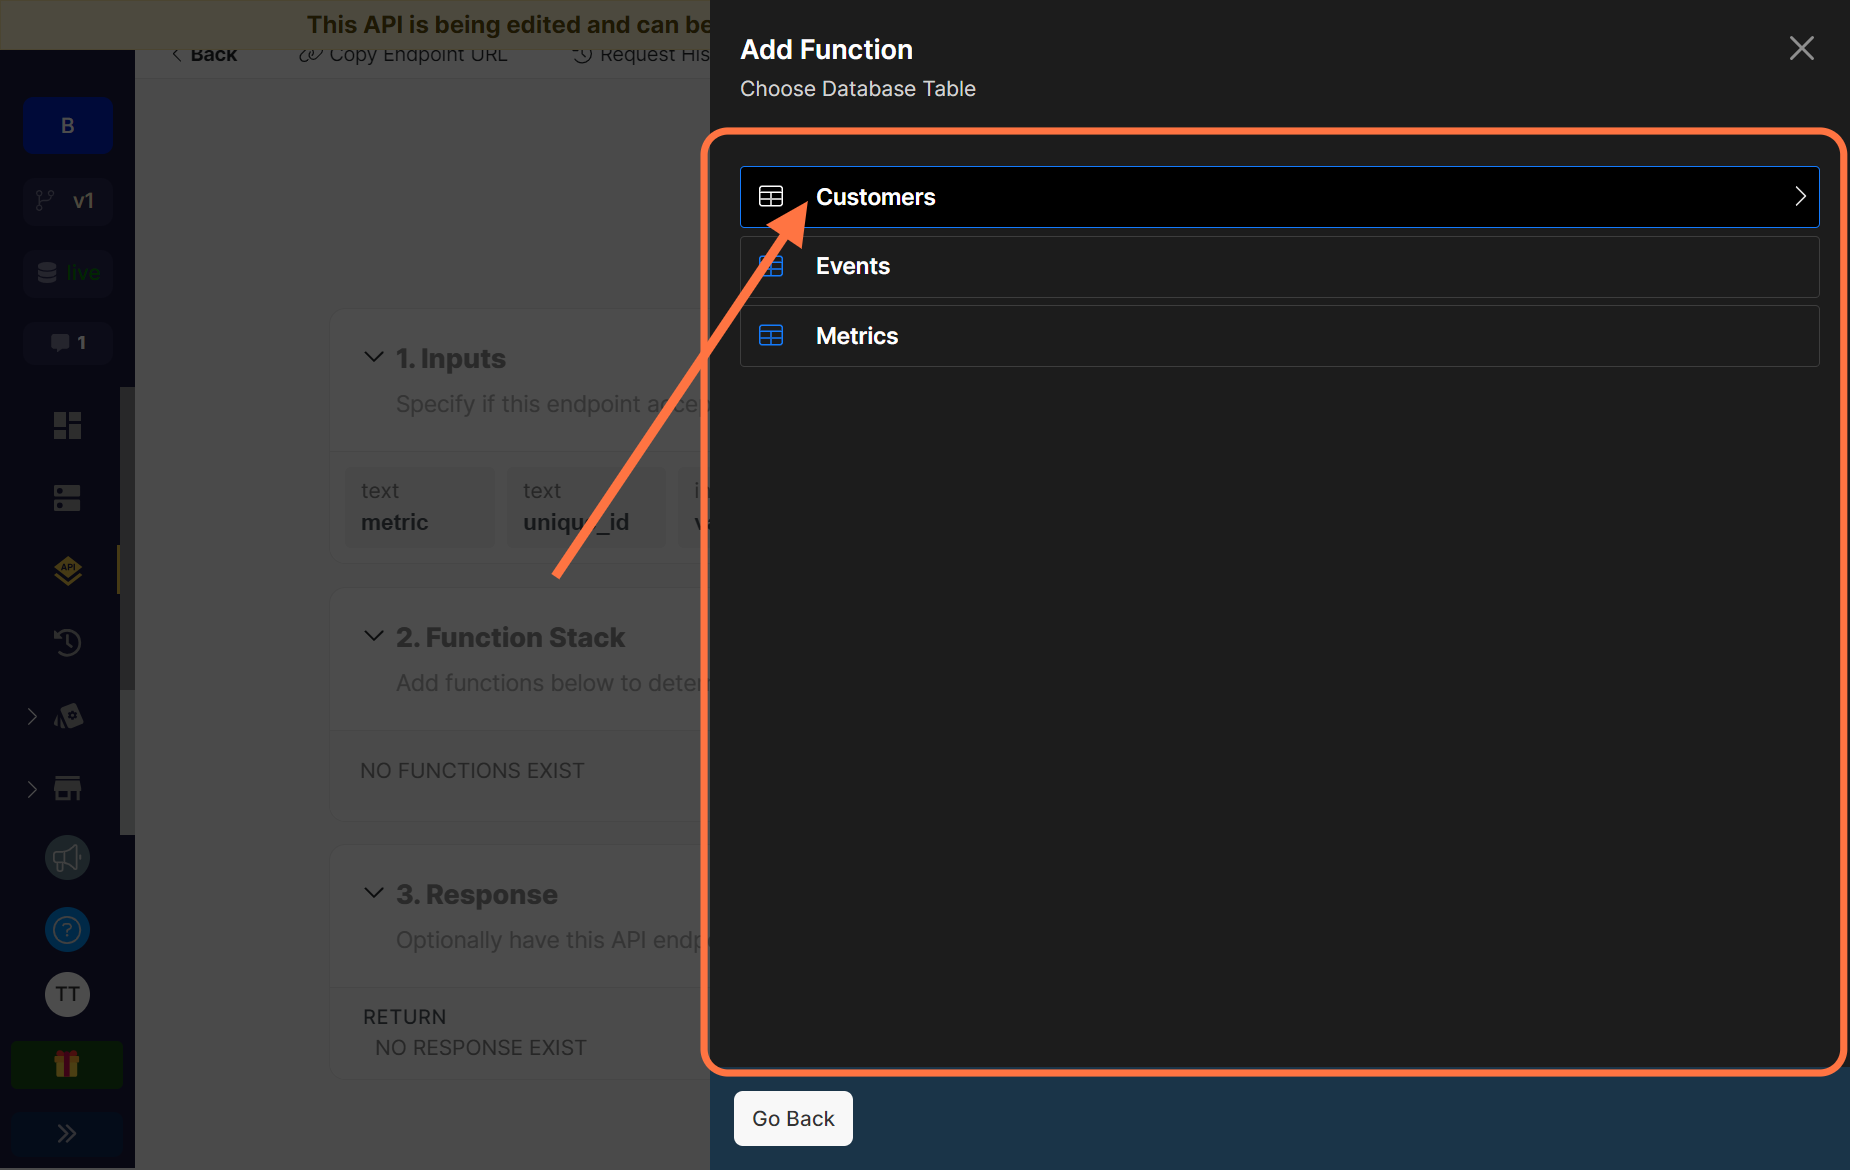
Next, select the Customers table from the list of tables.
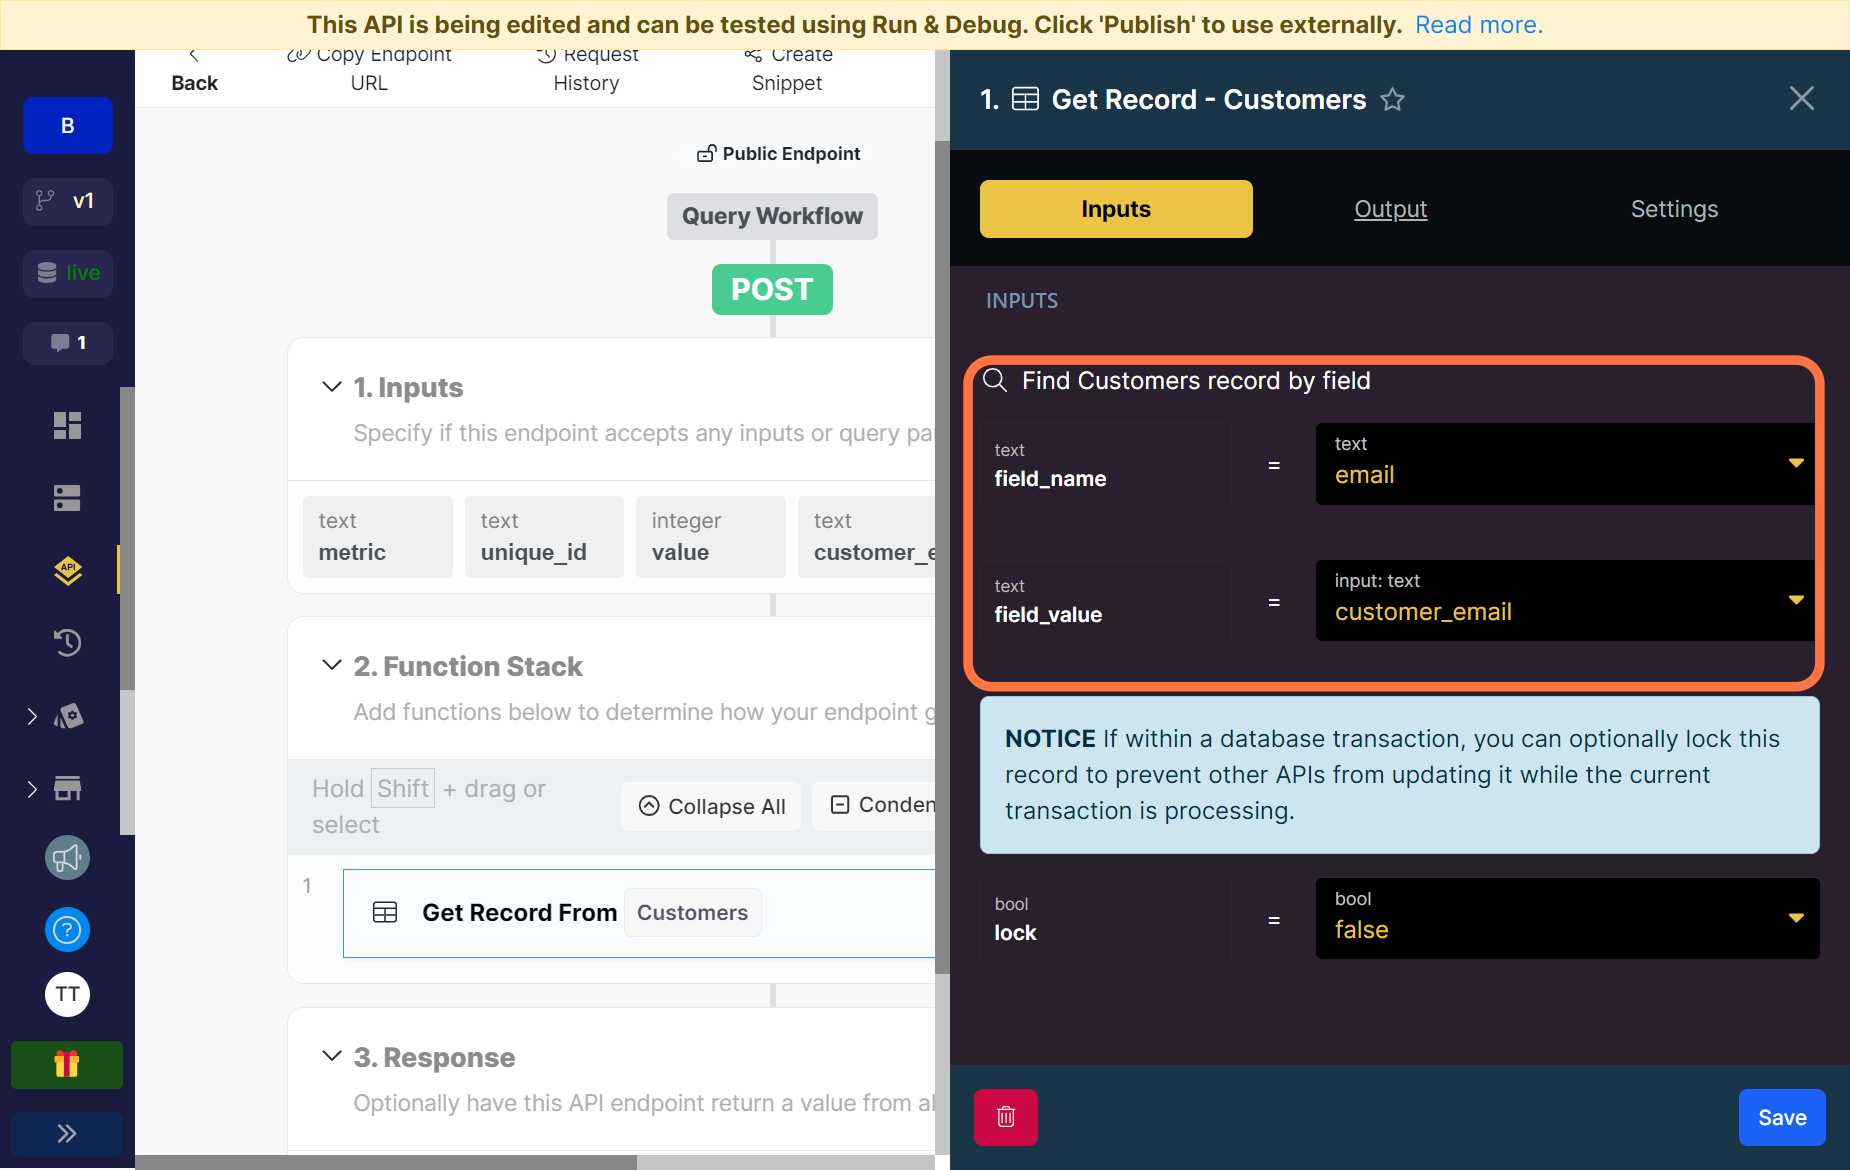
Now we need to let Xano know what customer we are looking for by choosing a field name in the table it can search by and also specifying the value that it will be searching for in that field.
For the field name, we are going to search using the email field because our input for the endpoint includes the customer email and then or the field value we’ll used the customer email input. Xano will look at the email field in the Customers table, search for the customer’s email that was passed into the input and then return that record as the output.
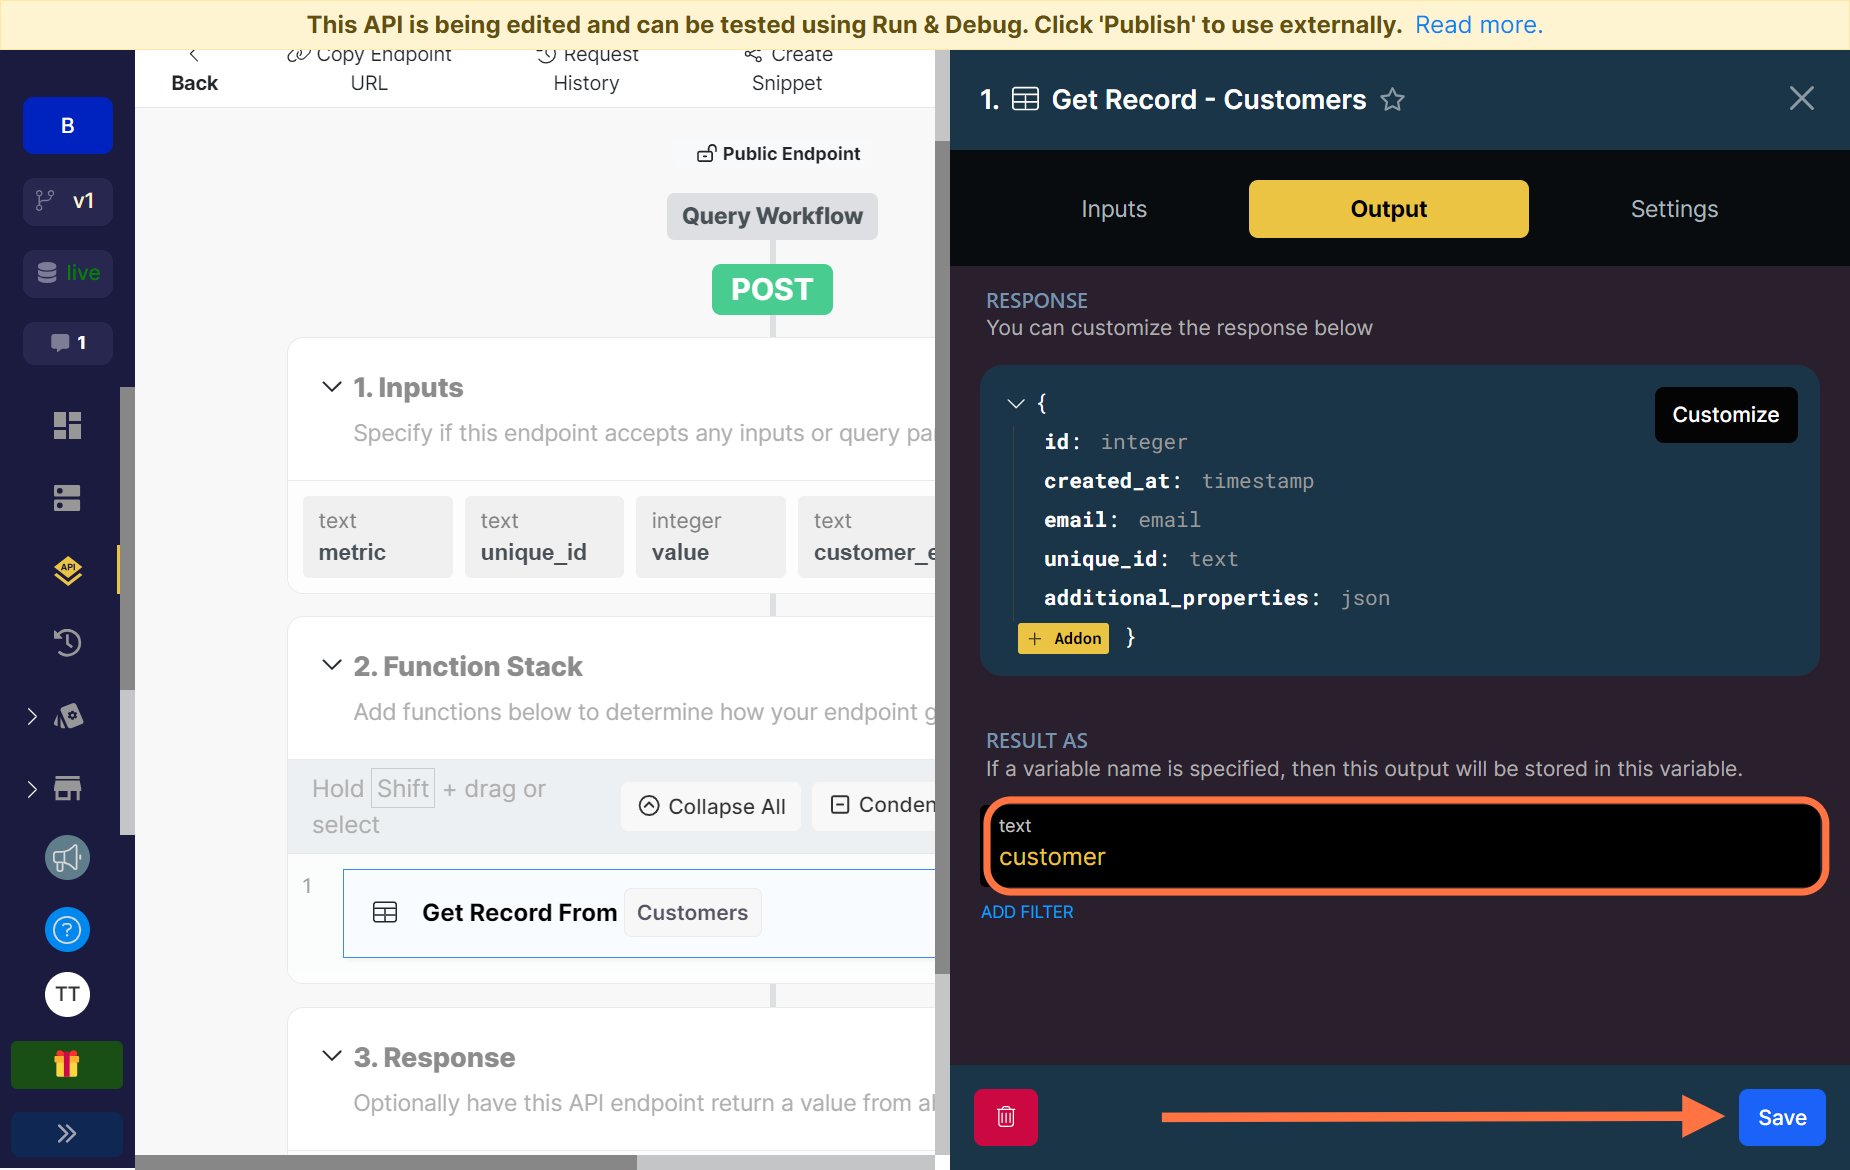
Click on Output to view the full details of the record that will be returned and rename the variable that it will be stored in to customer. Remember, what we need is the id.
The second function in our stack is to add the event to our database. This is pretty simple, just like we did for the customer and metric endpoints.
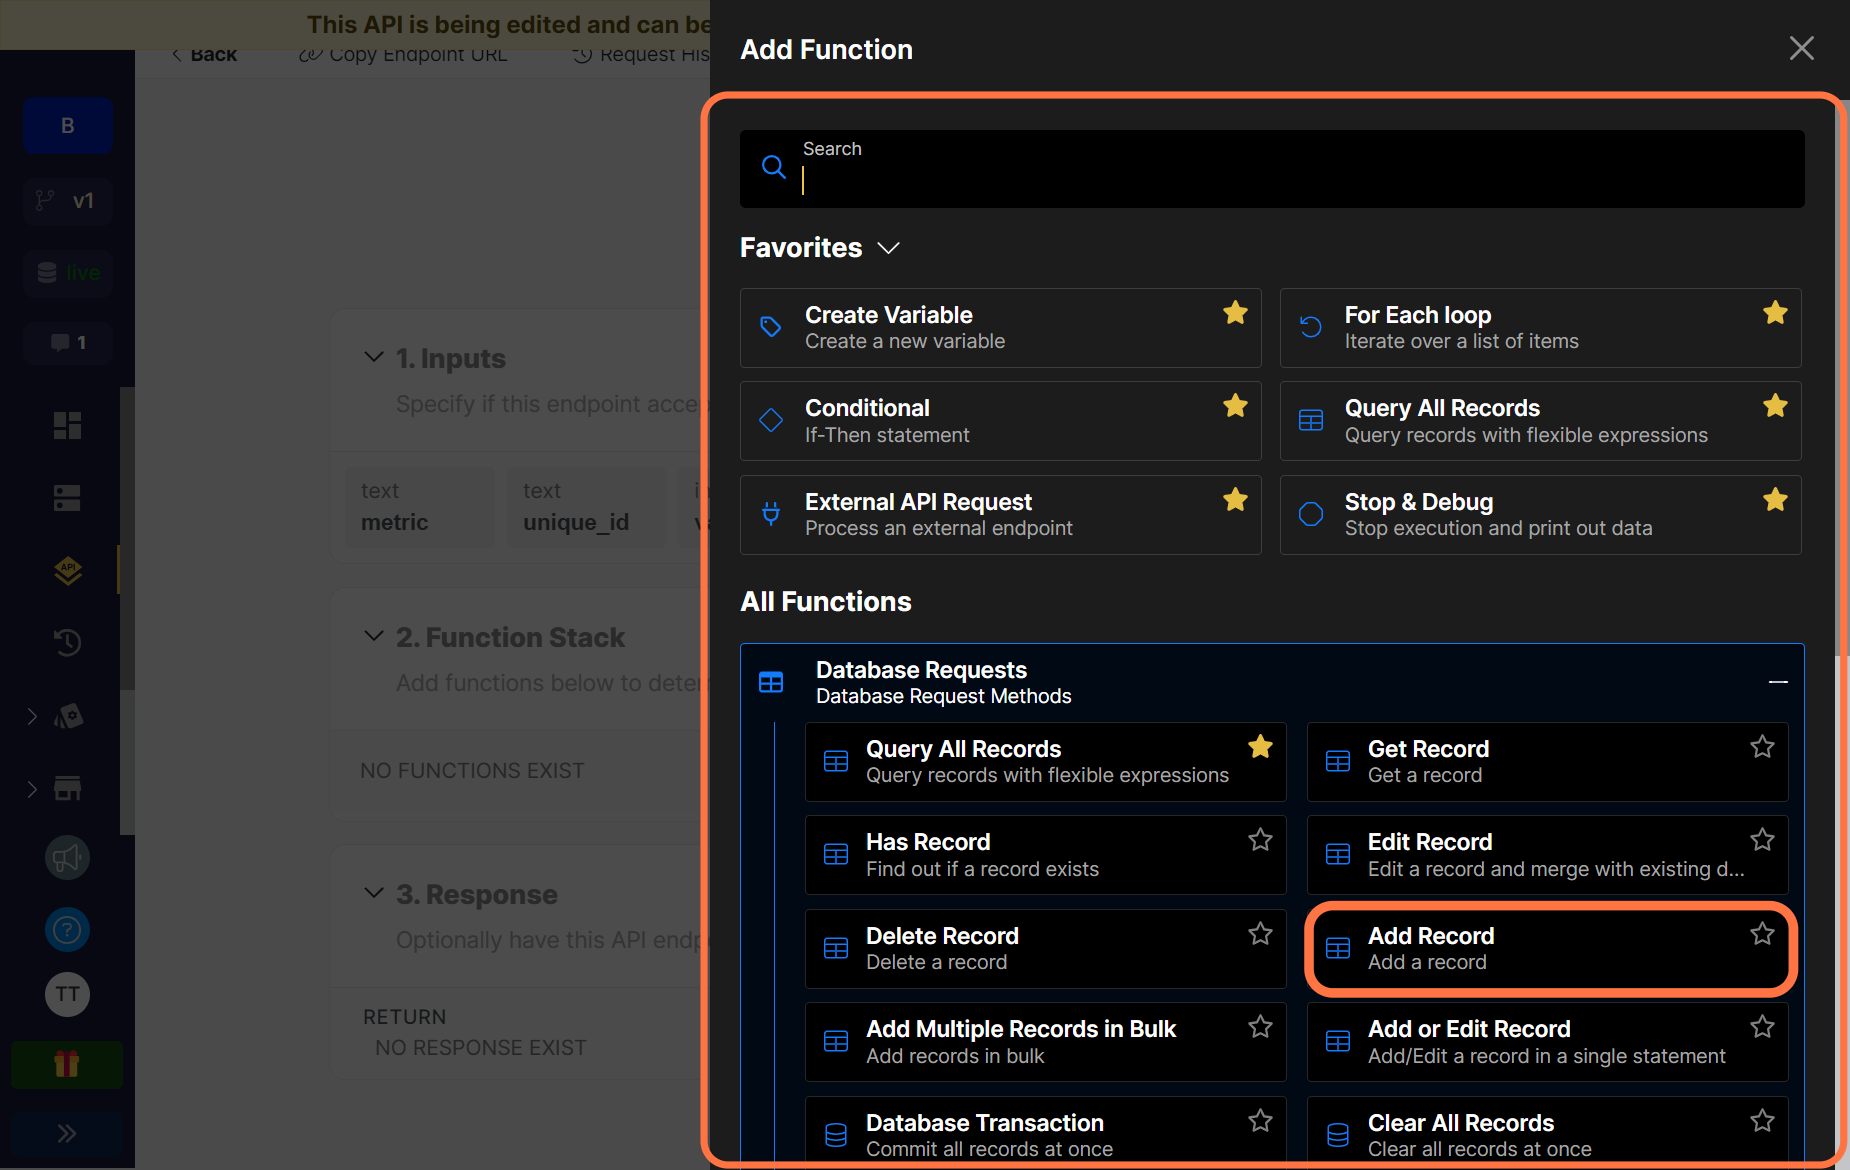
Click on Database Requests and select the Add Record function.
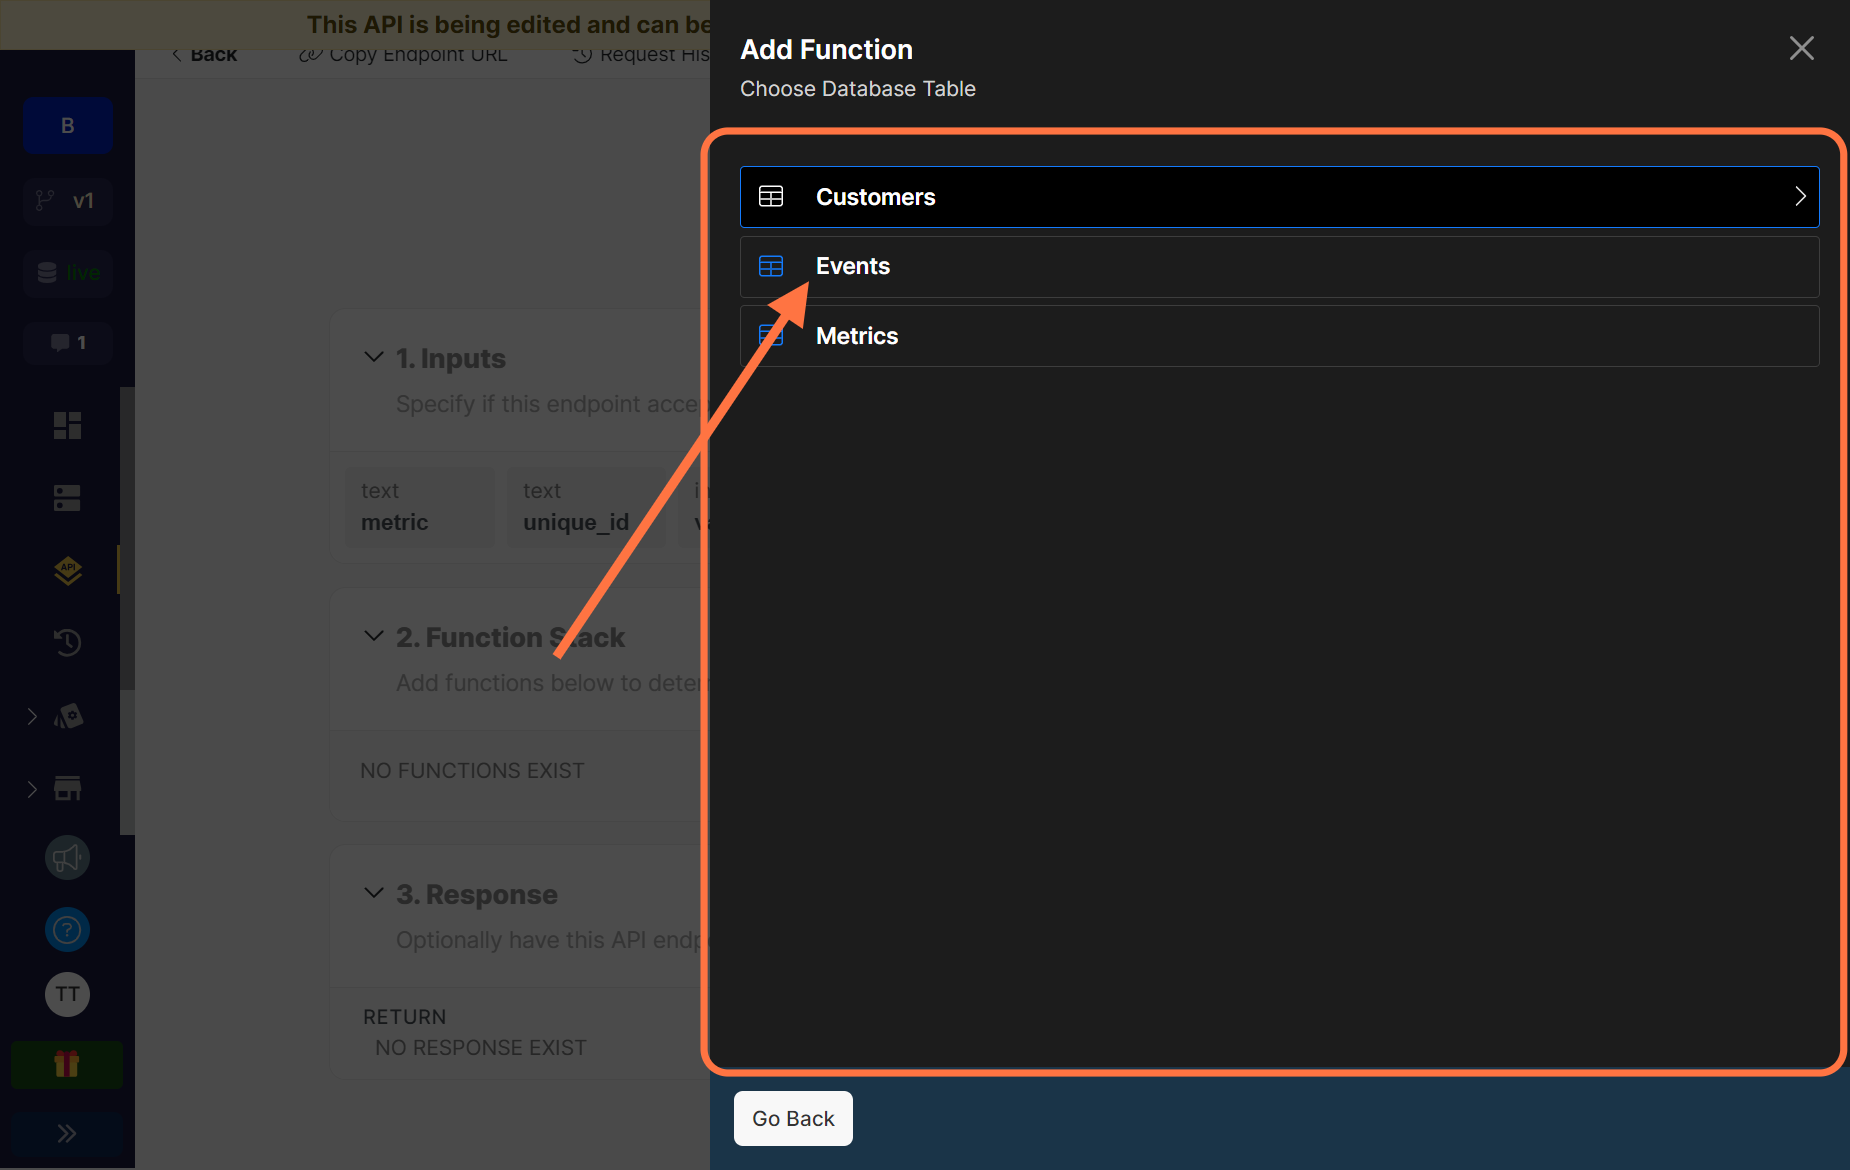
Select Events from the list of tables.
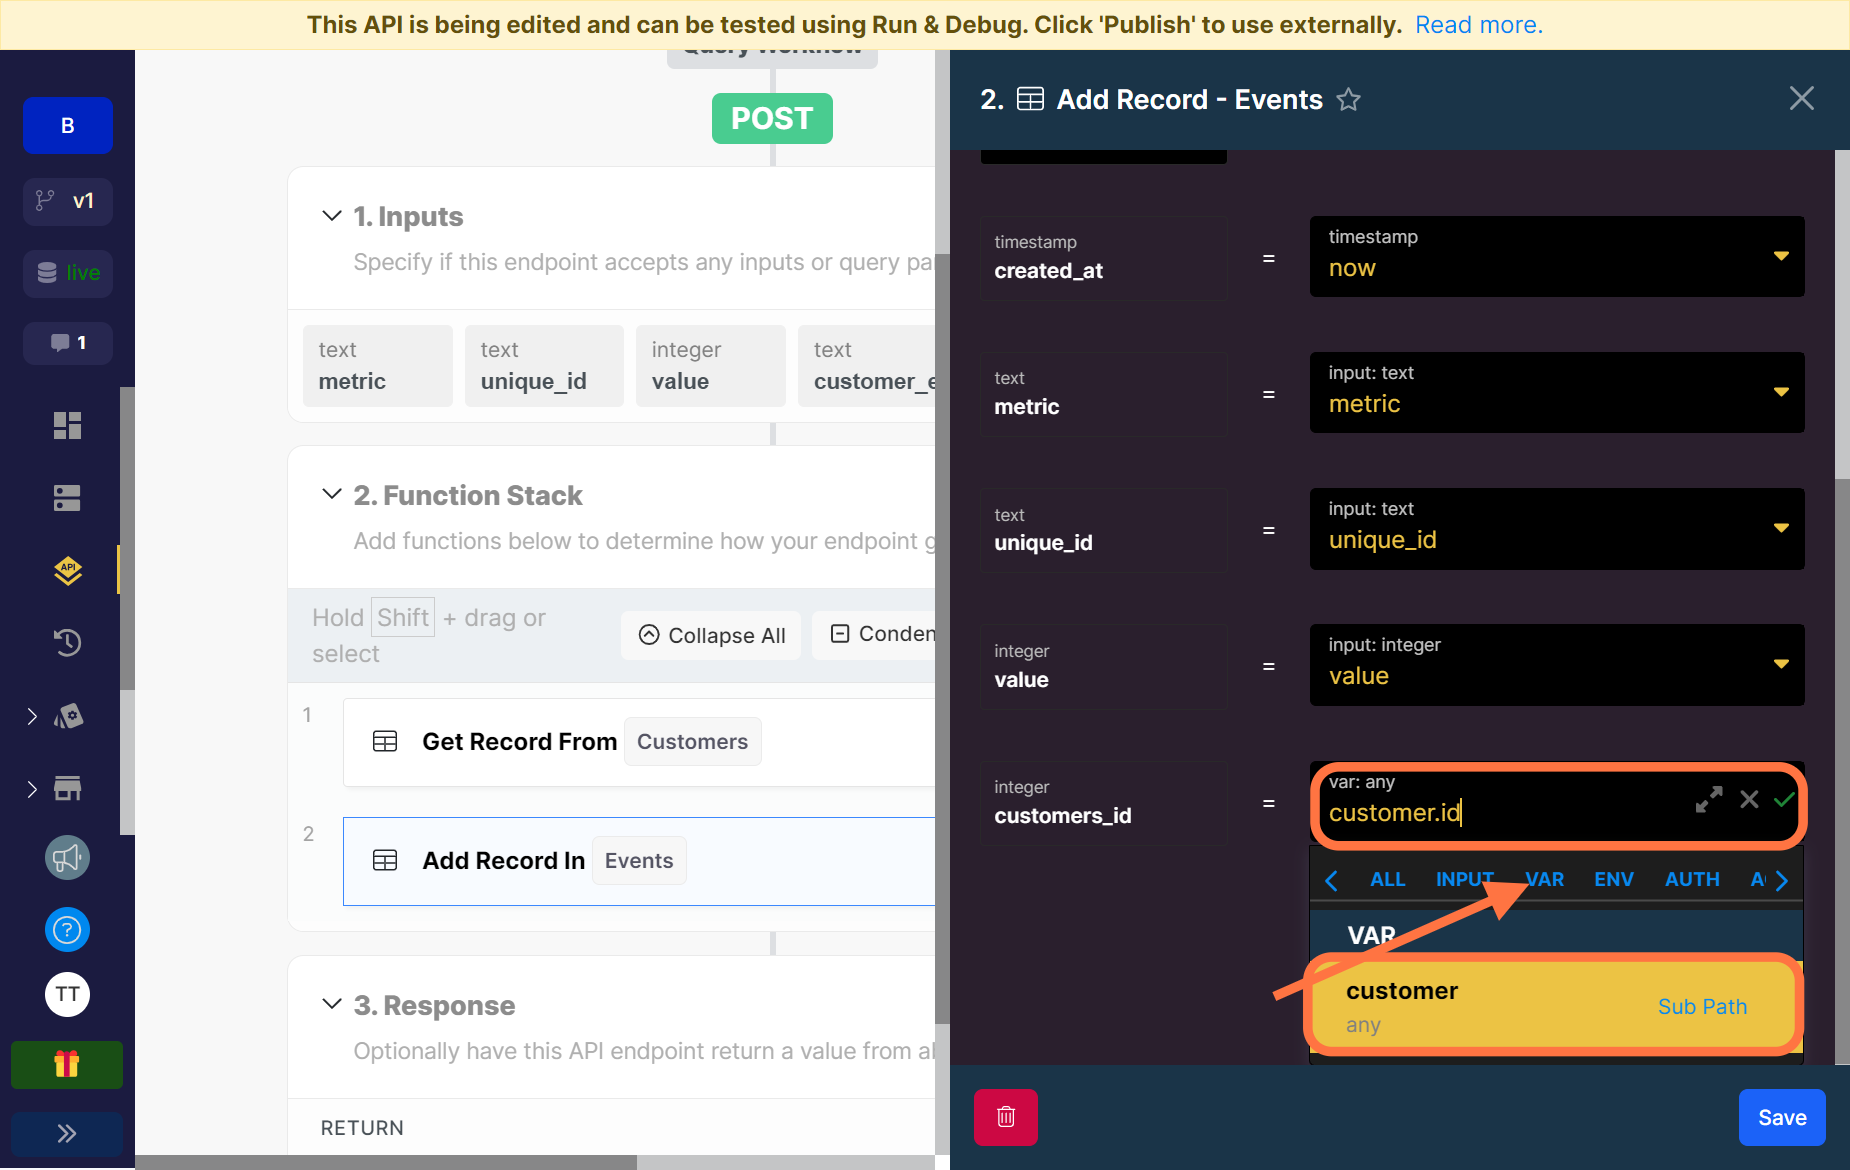
Xano would help populate all the fields with the inputs except the customer_id field from our Events table which will have 0 as the value. Delete it.
Click on VAR which will reveal the dropdown of variables from your function stack. Choose the customer variable which is what we named the output of the first function storing the details of the customer we searched for.
After doing that, simply move your cursor to the field and type in .id. This is called dot notation and it helps pull the value of the id from the customer details stored in the variable.
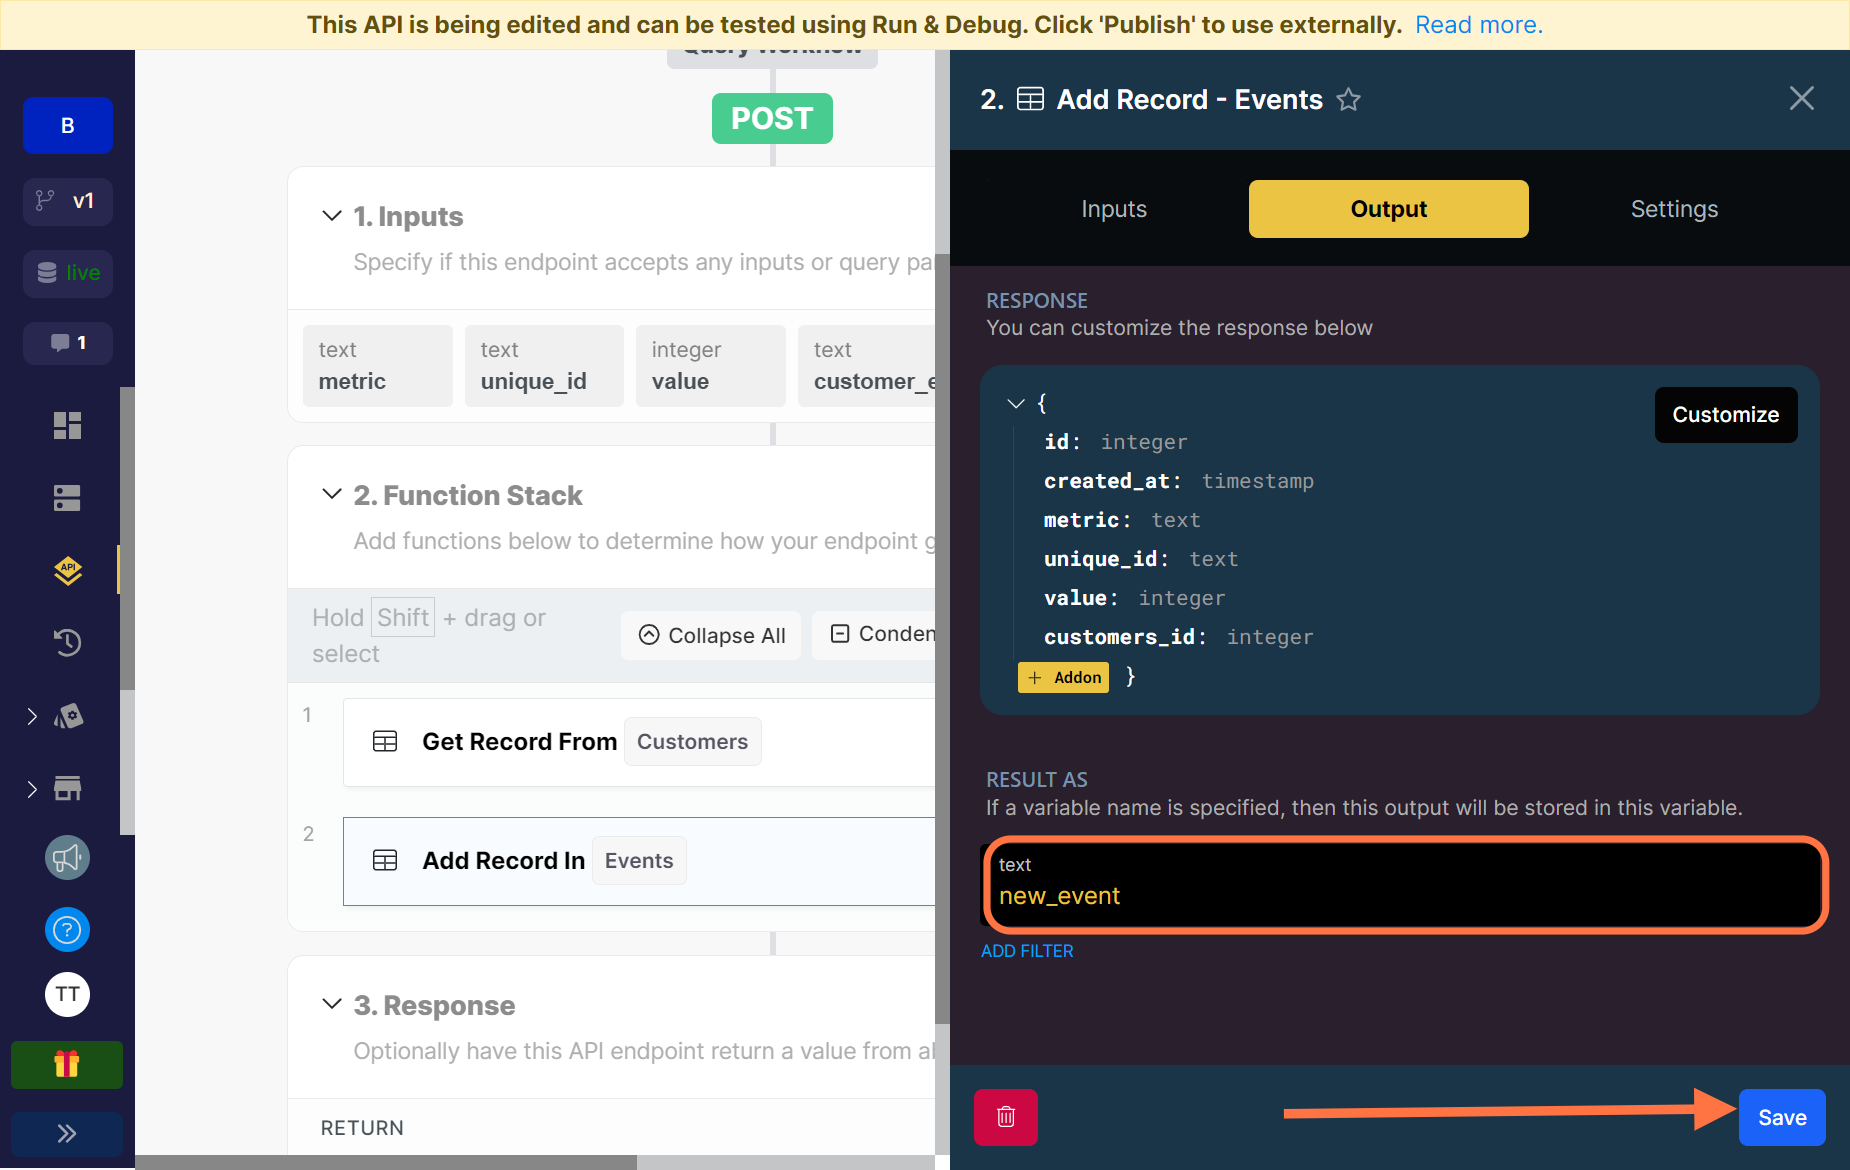
Review the response of the function and rename the output variable it will be stored in to new_event.
The next function is the first part in calculating the total number of events of each metric. We are going to fetch the record of the particular metric we are logging and event for, we are particularly interested in the value of the total_number_of_events field.
Click on Database Requests and select the Get Record function.
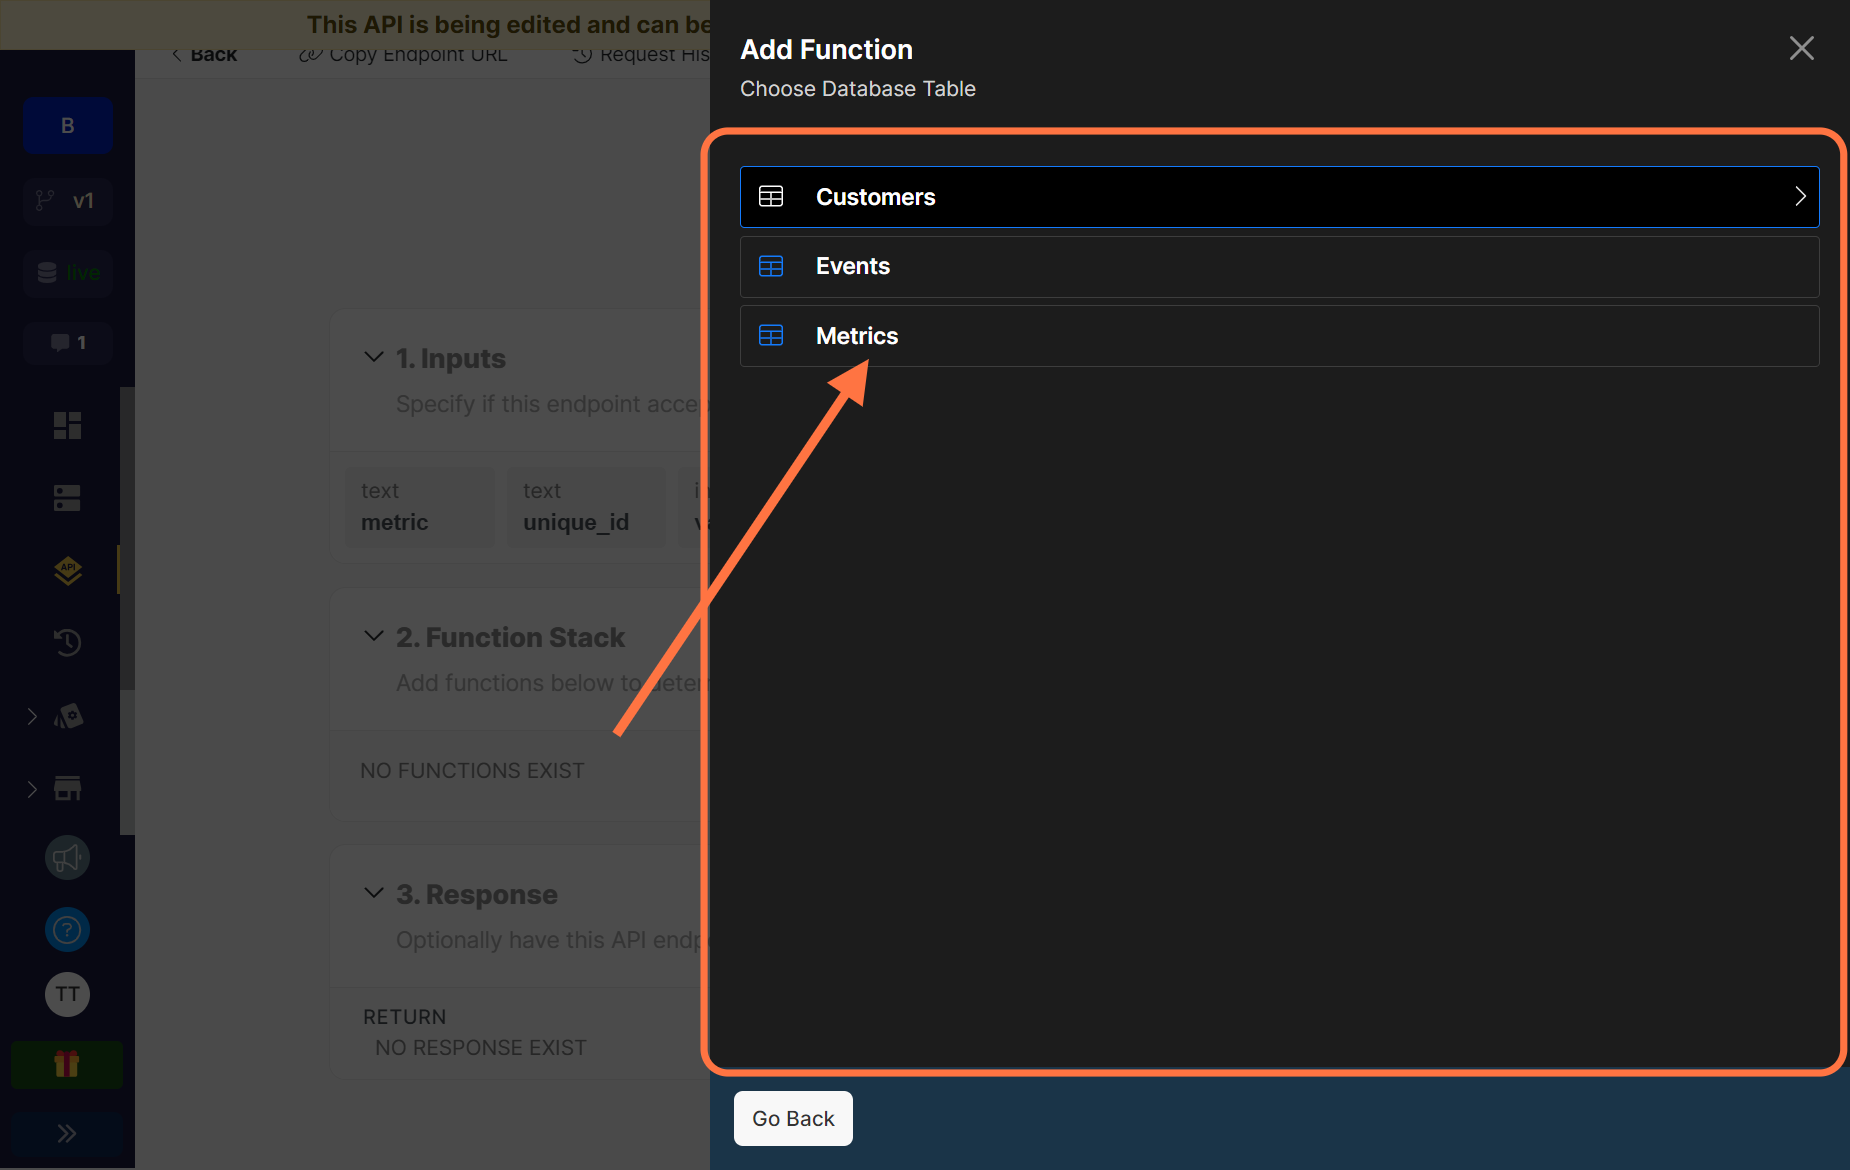
Select the Metrics table.
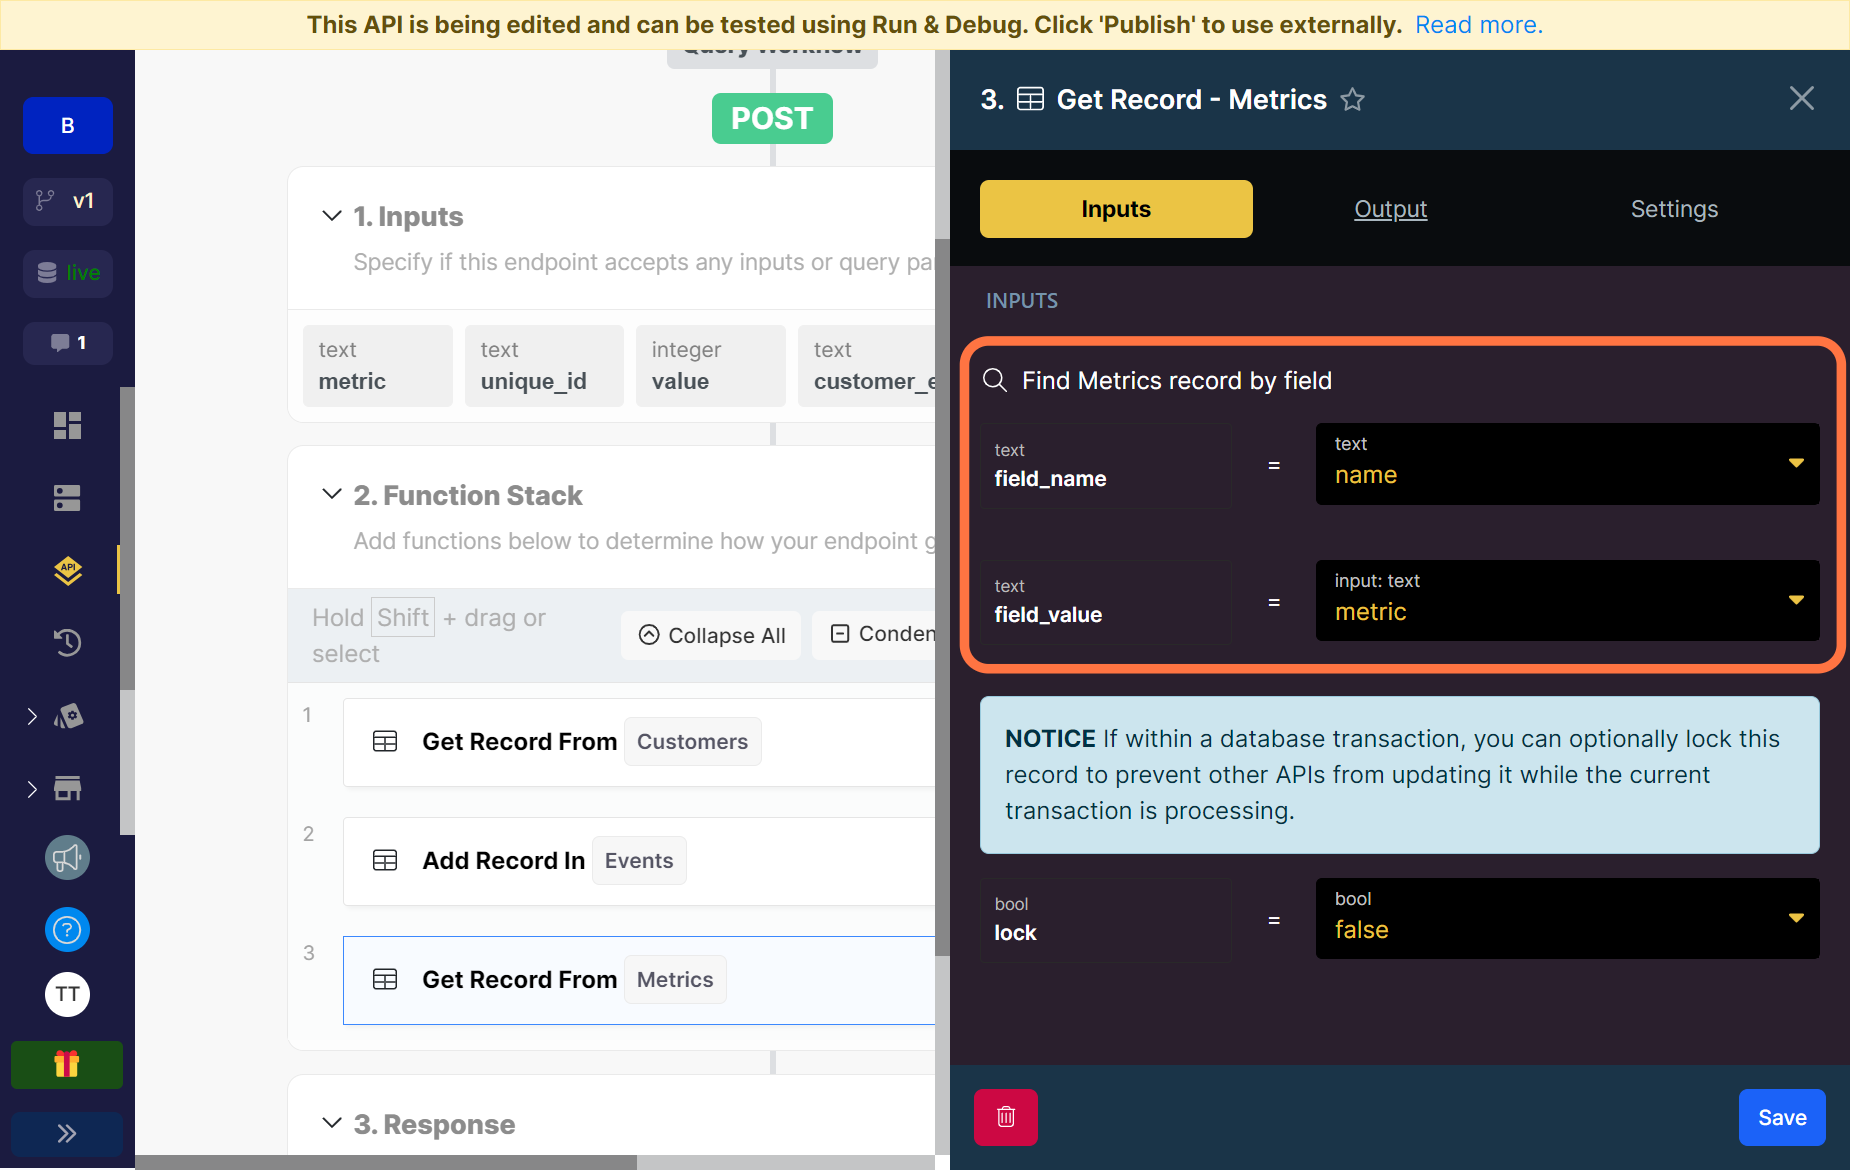
Just like when we wanted to get the customer record, we need to let Xano know what metric we are looking for by choosing a field name in the table it can search by and also specifying the value that it will be searching for in that field.
Here we will use the name field on the Metrics table and we’ll be searching for the metric we use in our input field.
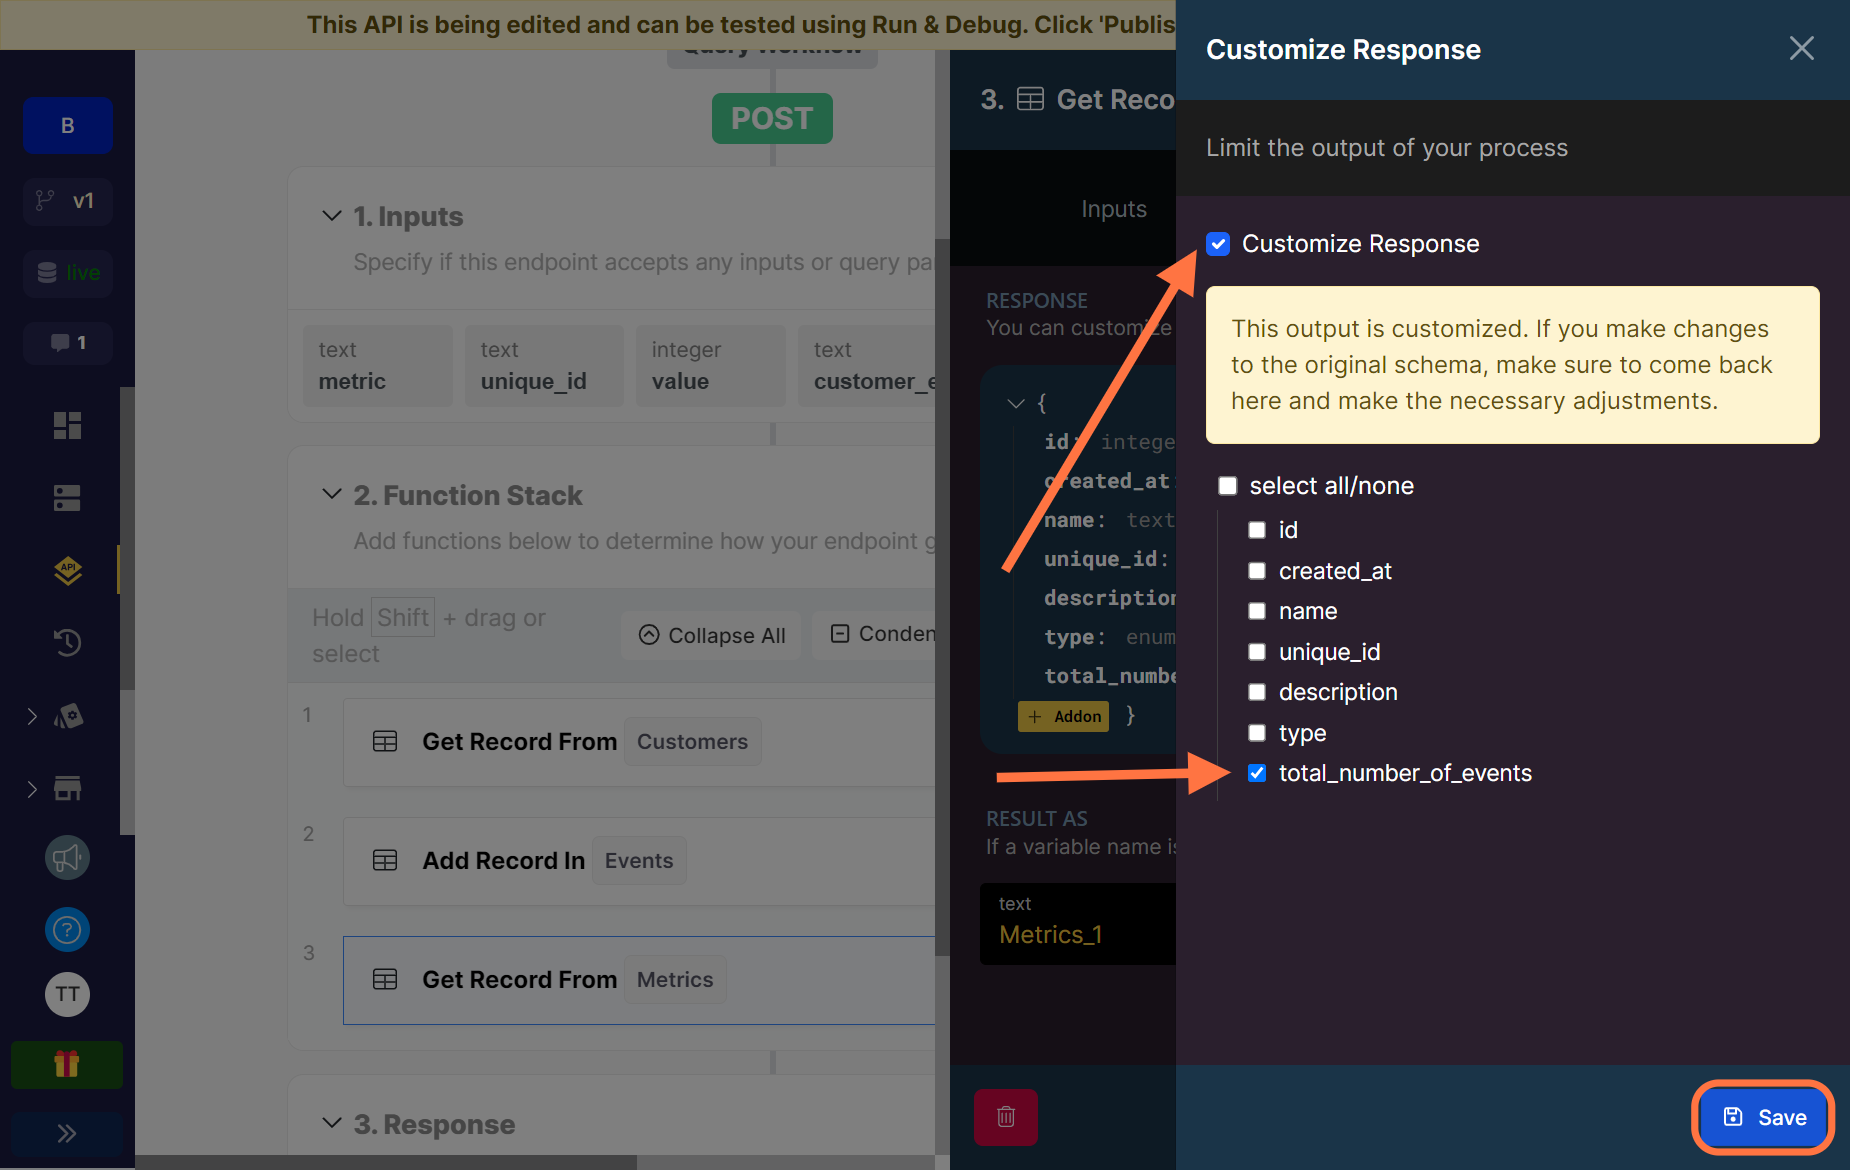
Next, head over to the Output tab and click on the Customize button and a side panel will open up. Tick the Customize Response checkbox and then tick only the total_number_of_events checkbox and save.
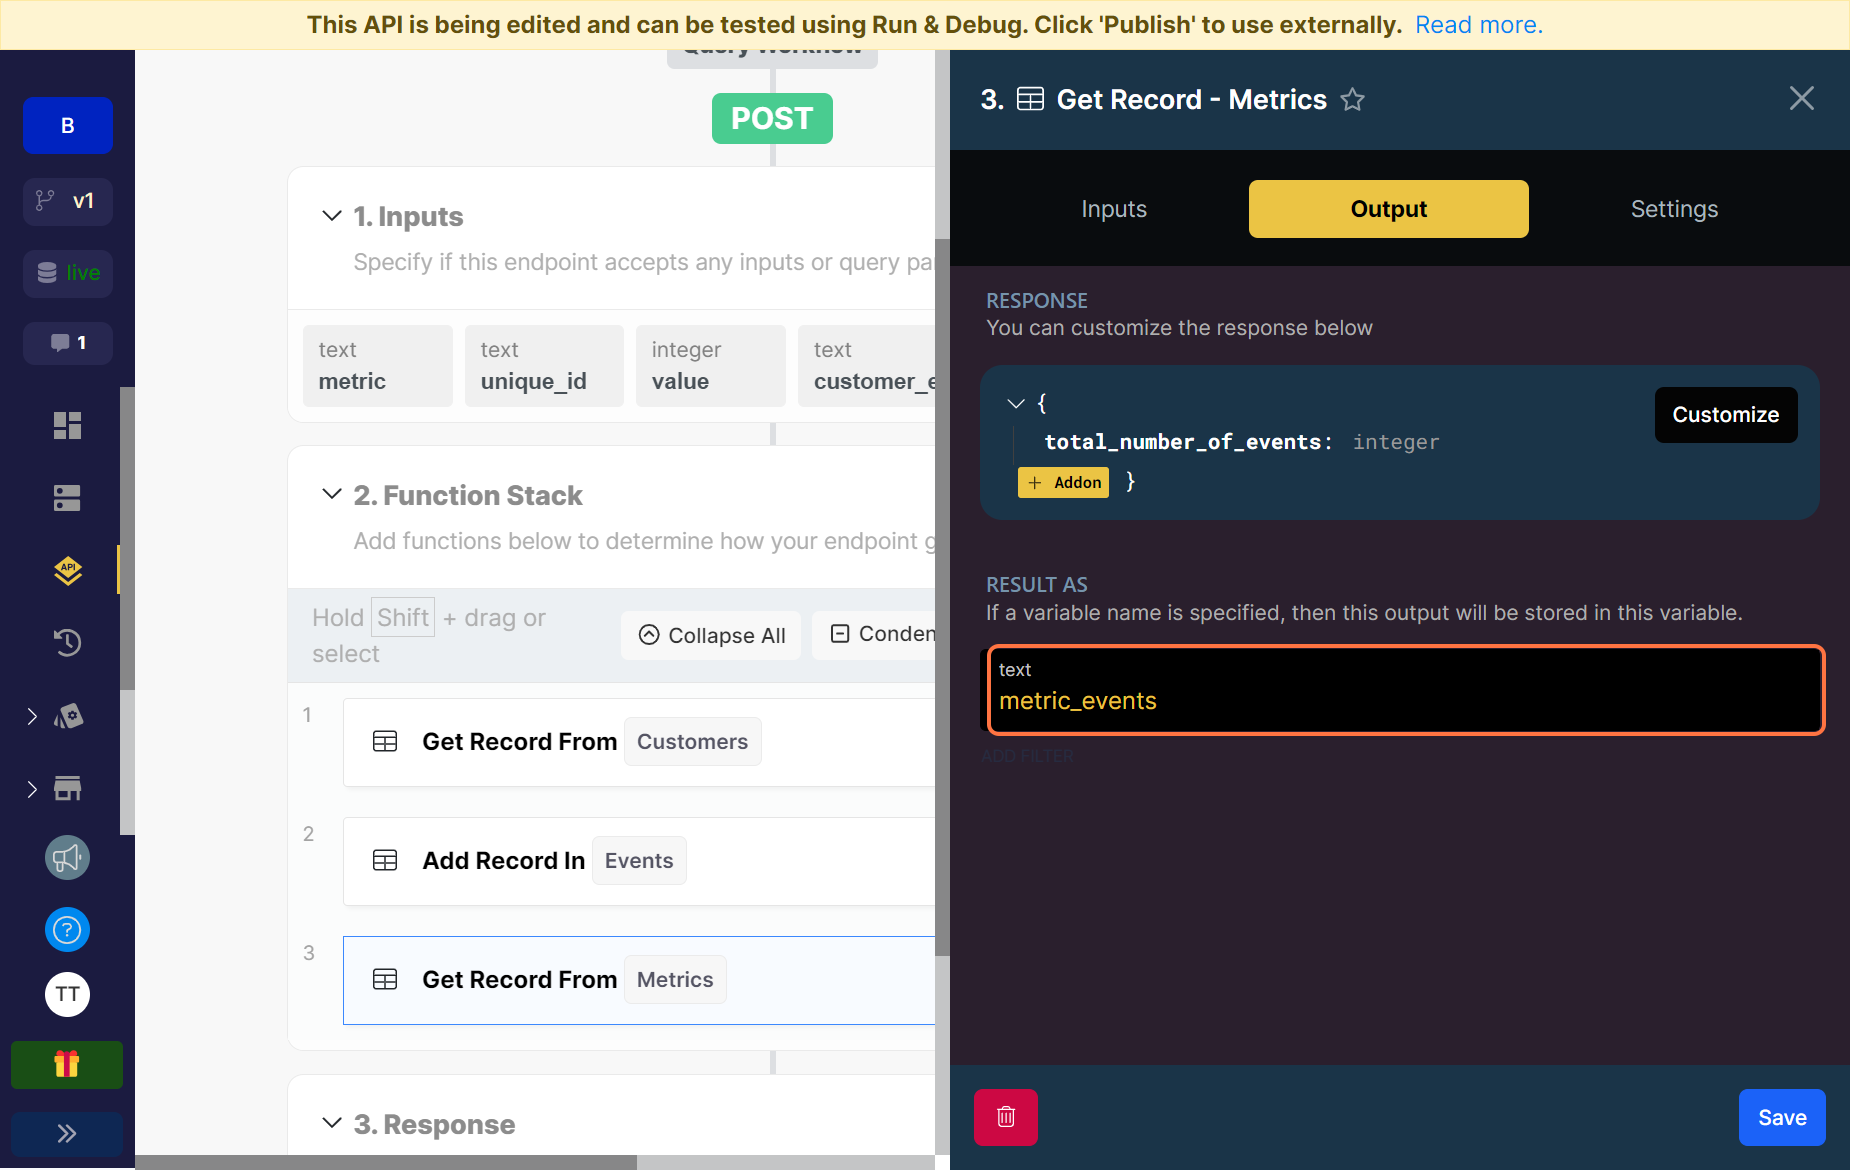
Rename the output variable to metric_events and save your function.
Our last function is going to help us calculate and update the value of the total events that a metric has. This way, every time an event is logged, the value of the total events the metric has is updated.
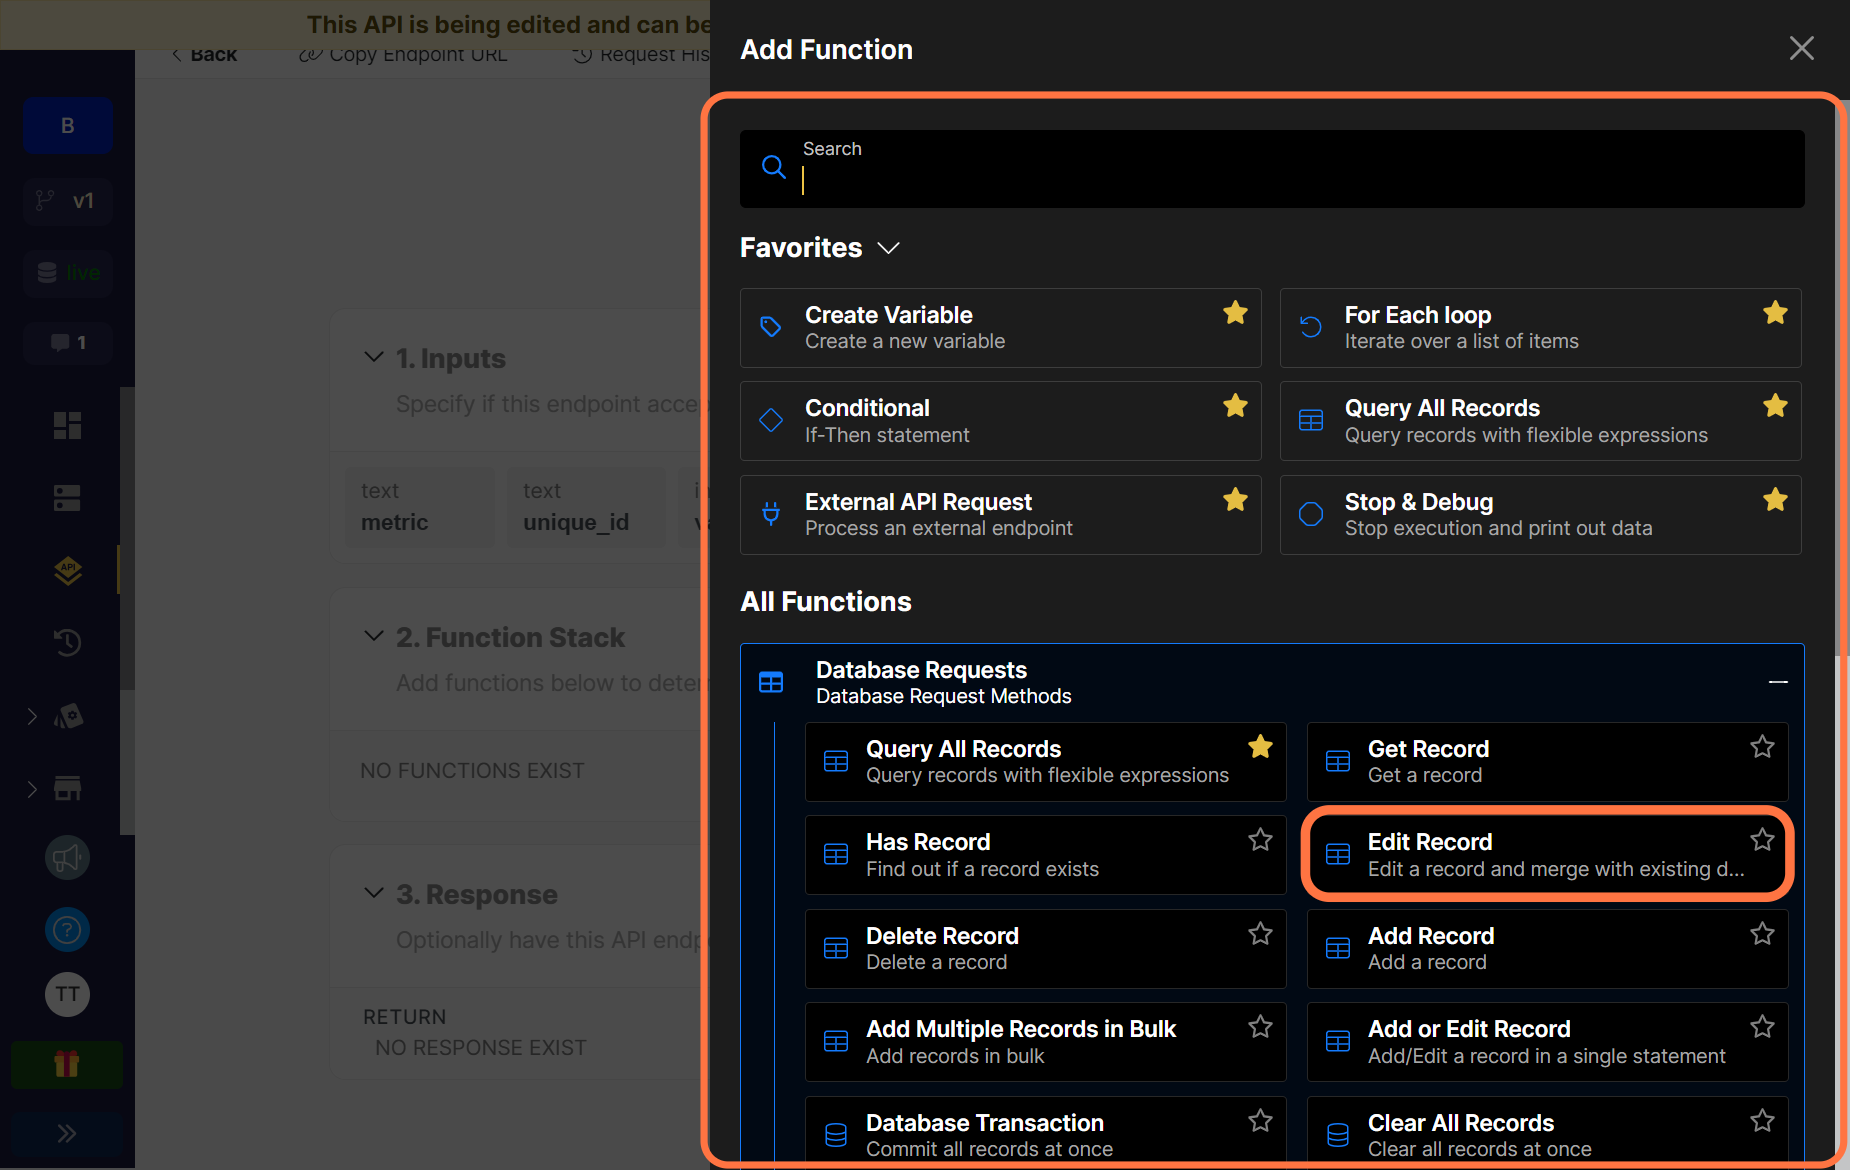
Click on Database Requests and select the Edit Record function.
Select the Metrics table.
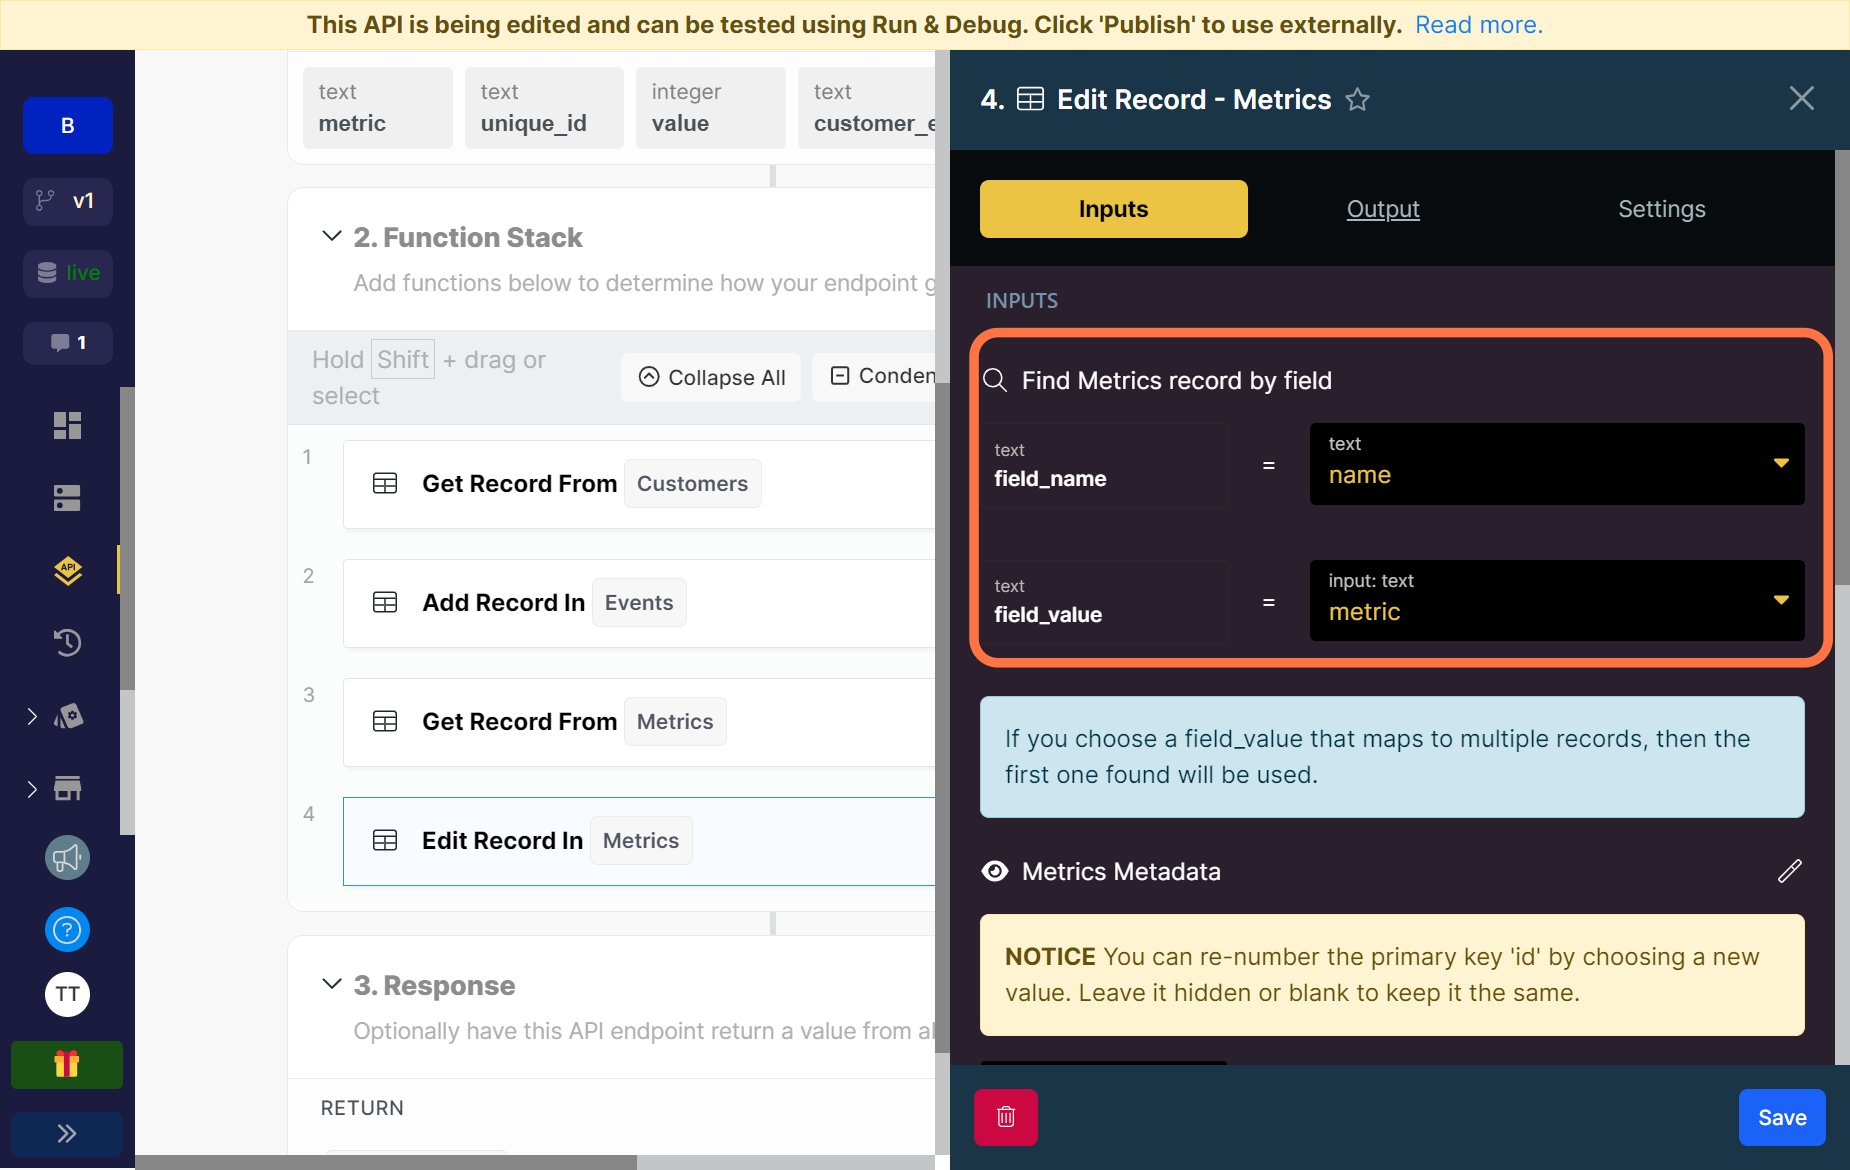
As in the previous function, select the field name to search by and the field value to search for. This way Xano knows what record to edit.
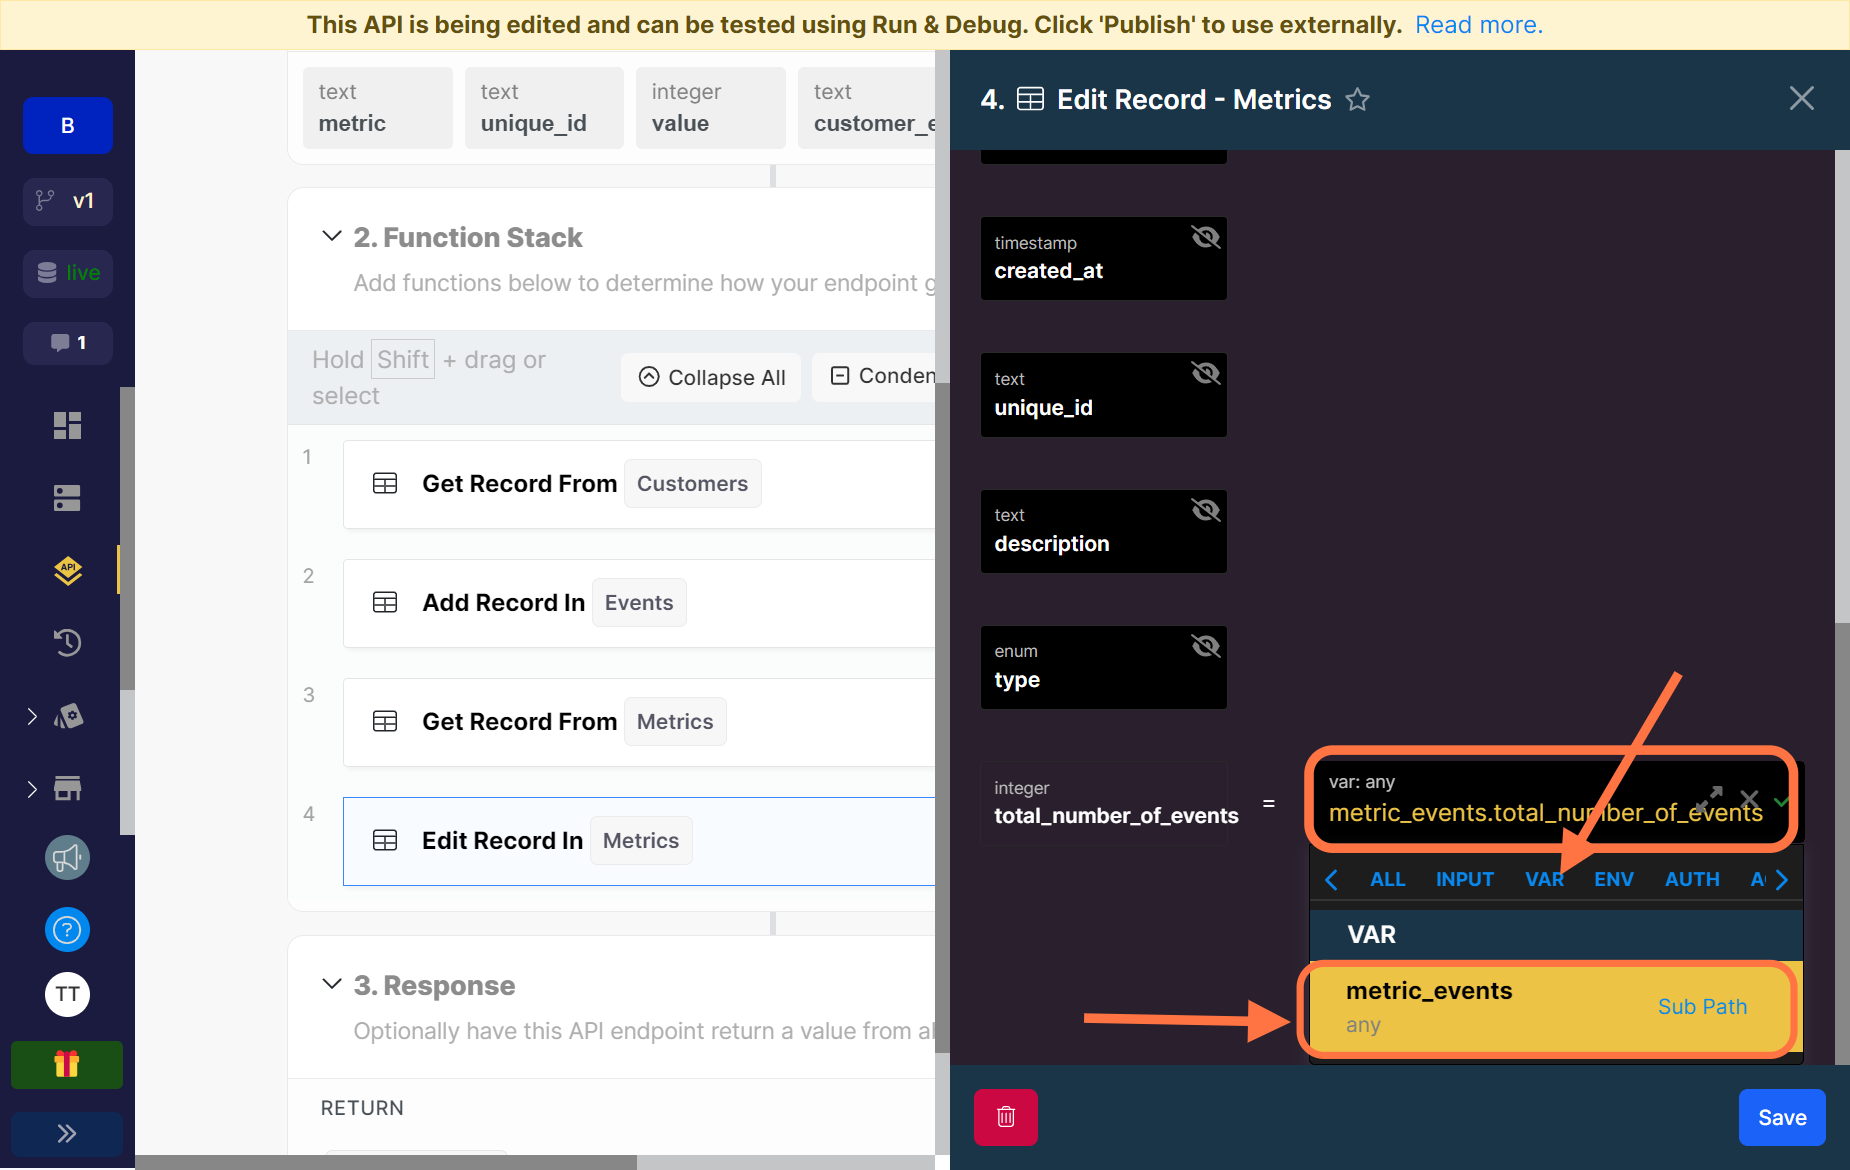
Scroll down and hide all the fields from our Metrics table except the total_number_of_events field which is the only field we want to edit.
Click on VAR and choose the metric_events variable from our previous function. Move your cursor to the field and type in .total_number_of_events. This allows Xano to pull the current value of the total number of events of the metric that we got in the previous step.
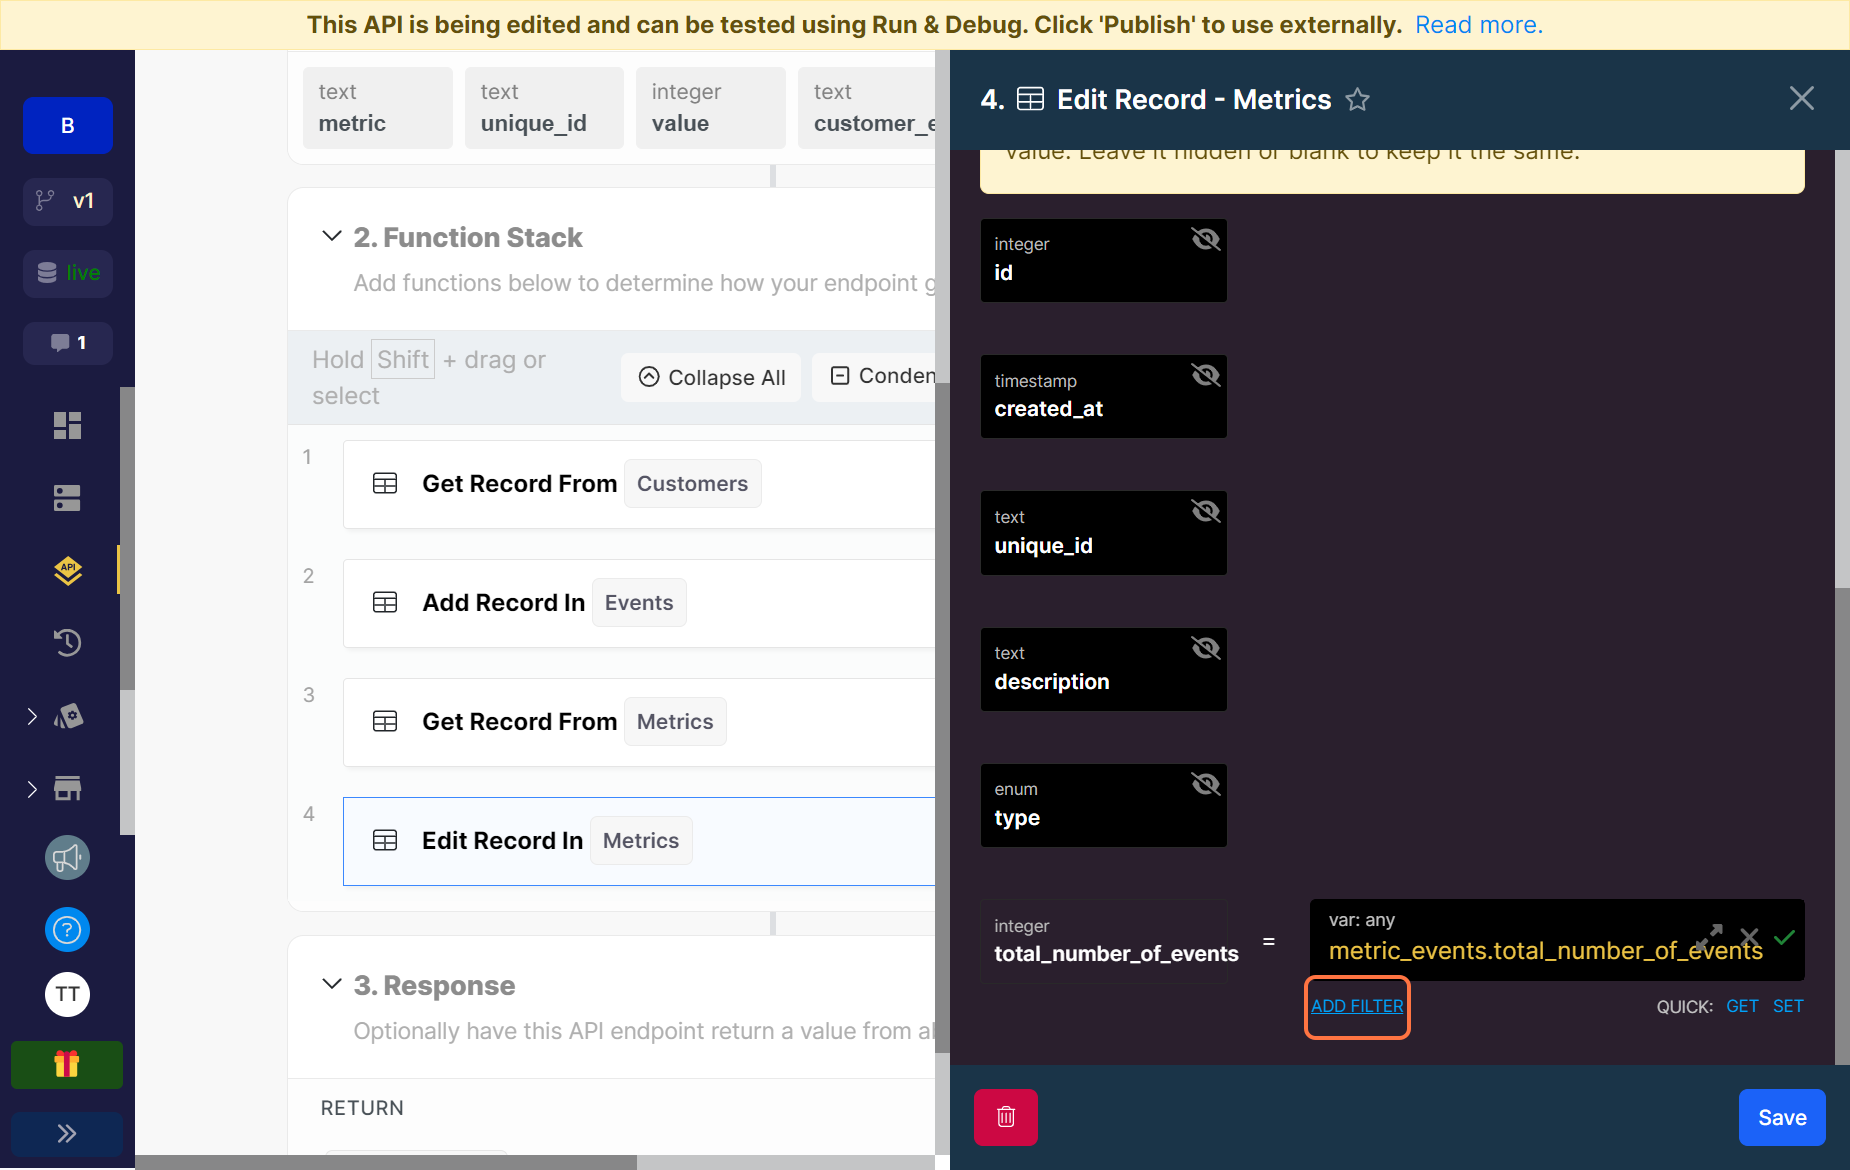
Click on ADD FILTER underneath the field.
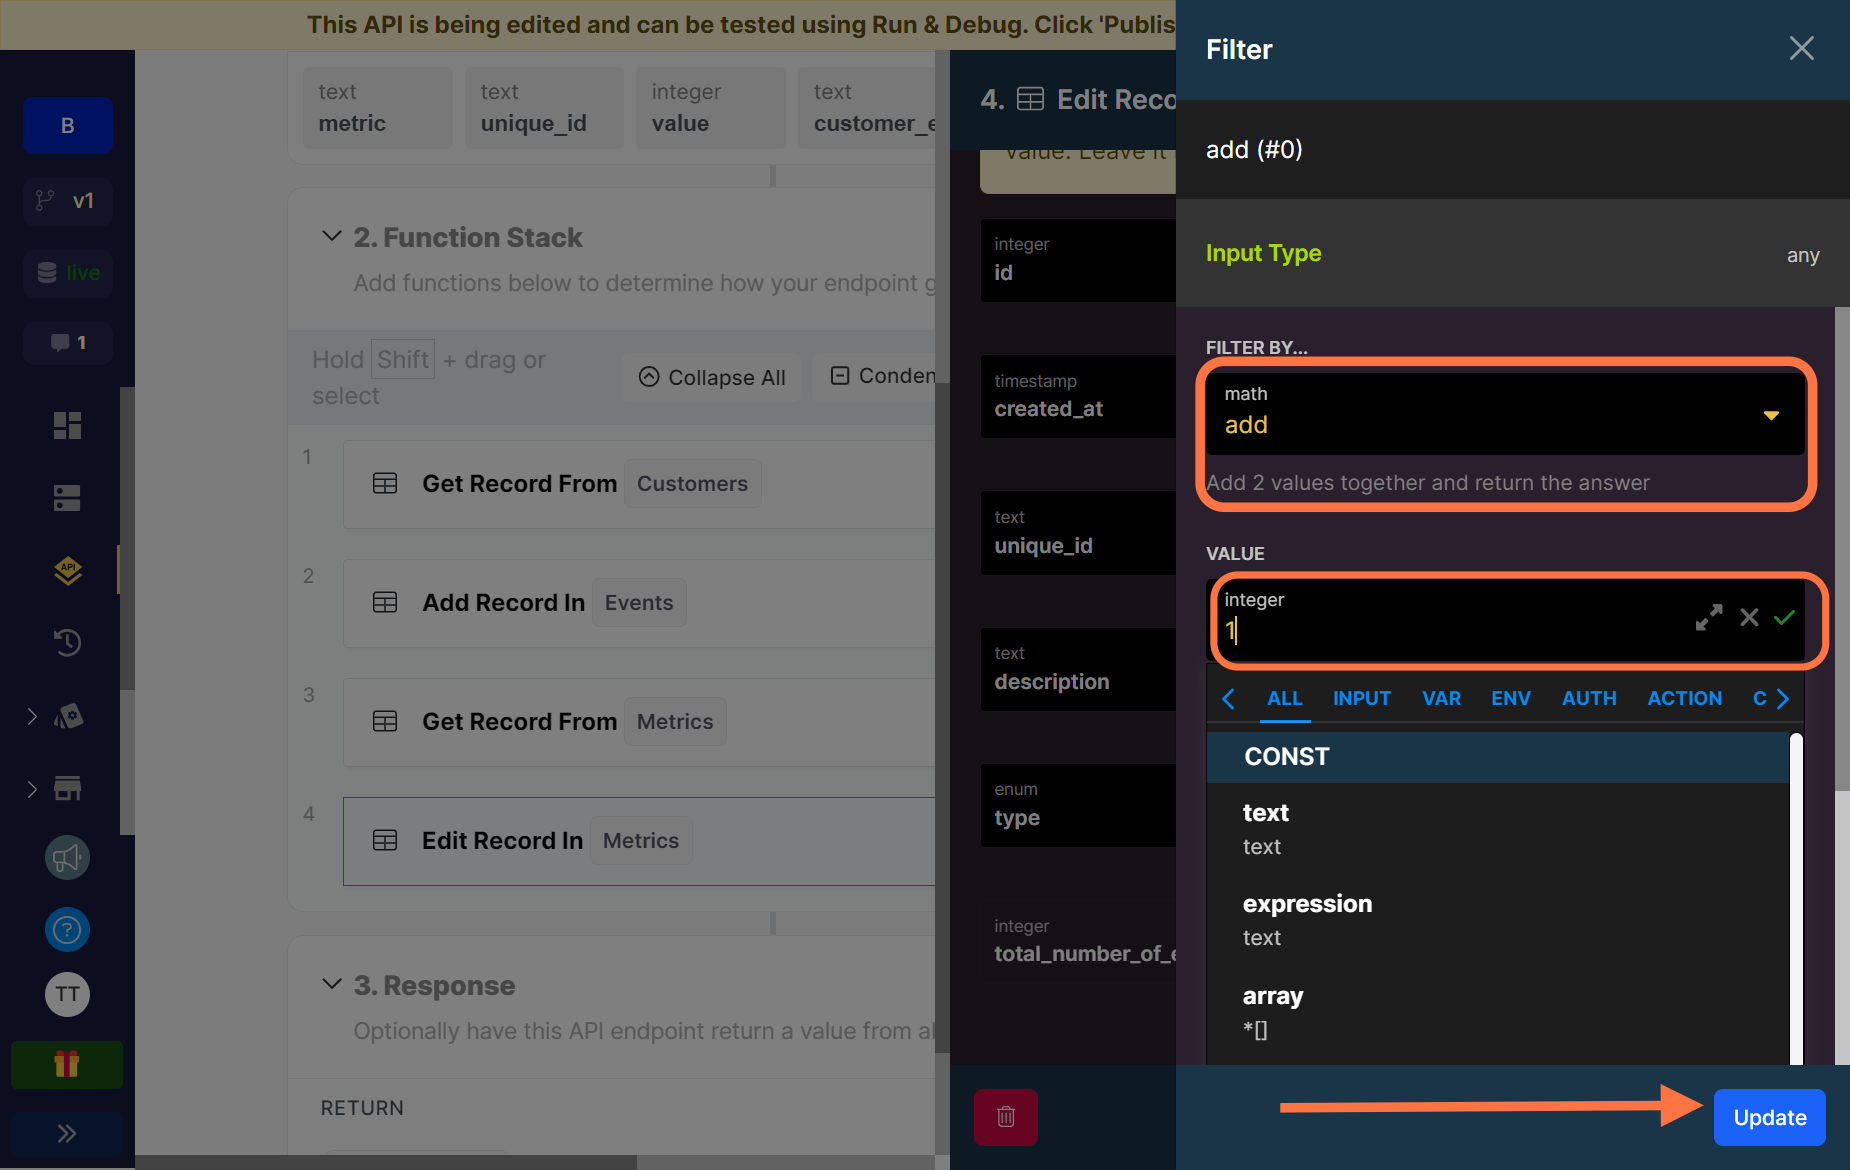
In the filter by field on the side panel that pops up, search for and select add. This is a math operation that allows you add two values together. In the field for value, enter 1 and click on update.
What we’ve done here is created a function that searches for the current value of the total events of a metric and then adds one to that value every time a new event is logged.
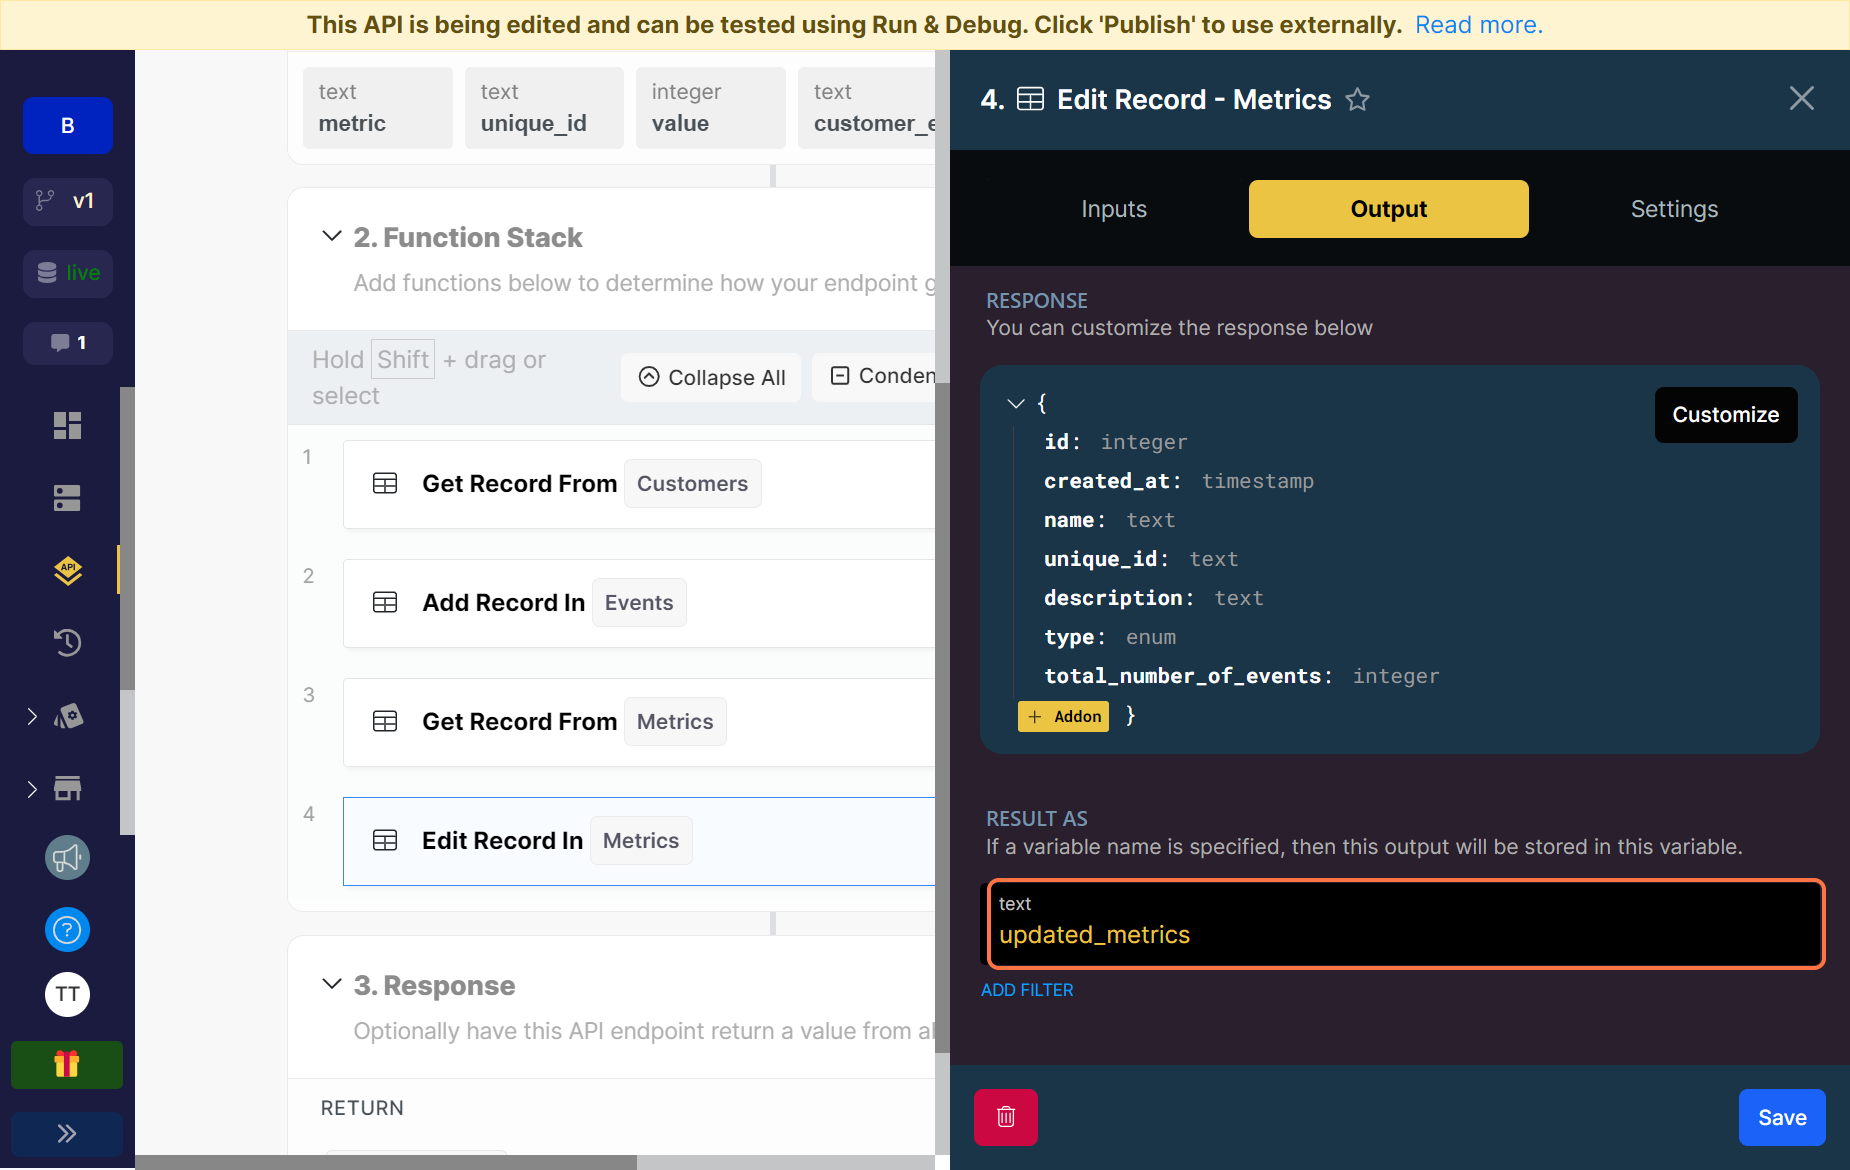
As usual, rename the variable that stores the result of our function to updated_metrics.
Finally, let’s customize the response for our endpoint.
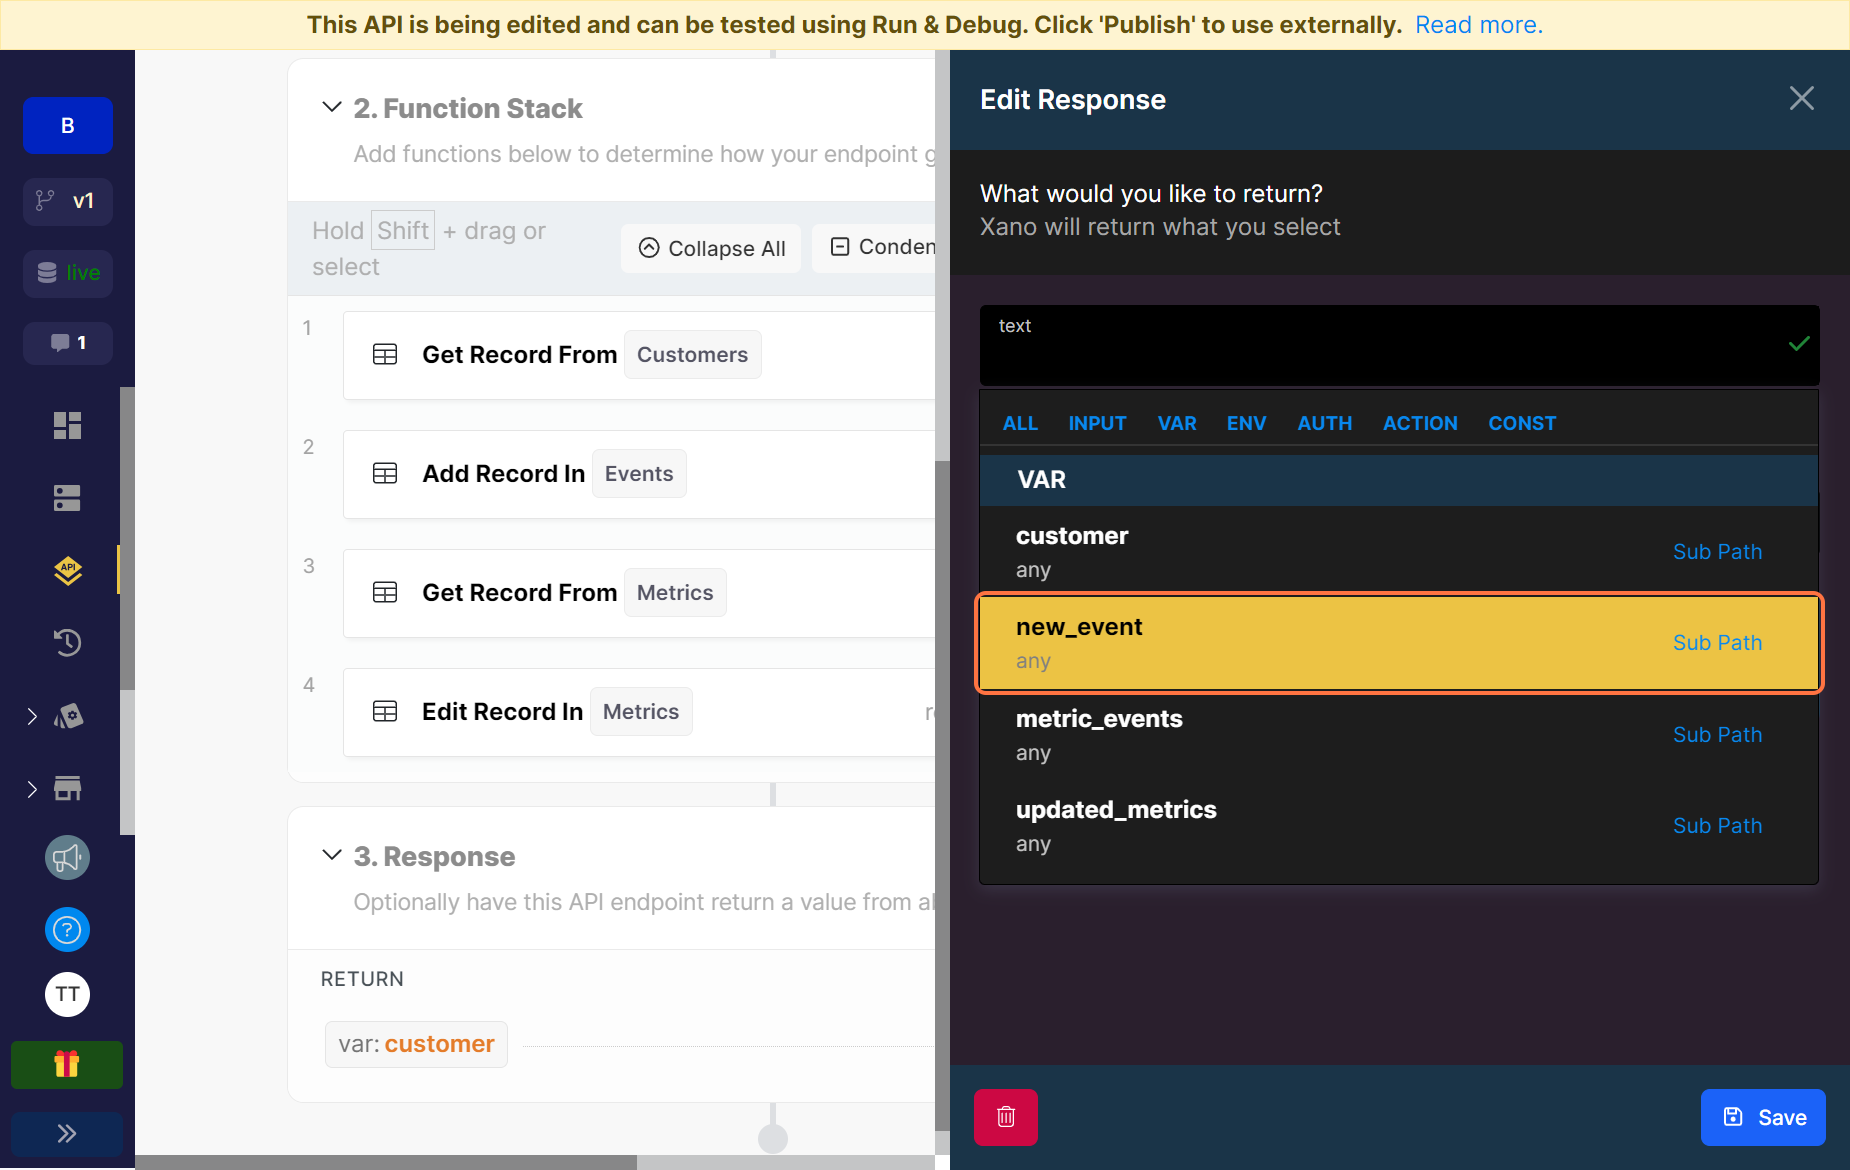
Since this is an endpoint to add a new event, we can leave the final response as the output result from our second function where we added a new record in the Events table.
Click on VAR and select new_event from the list of variables.
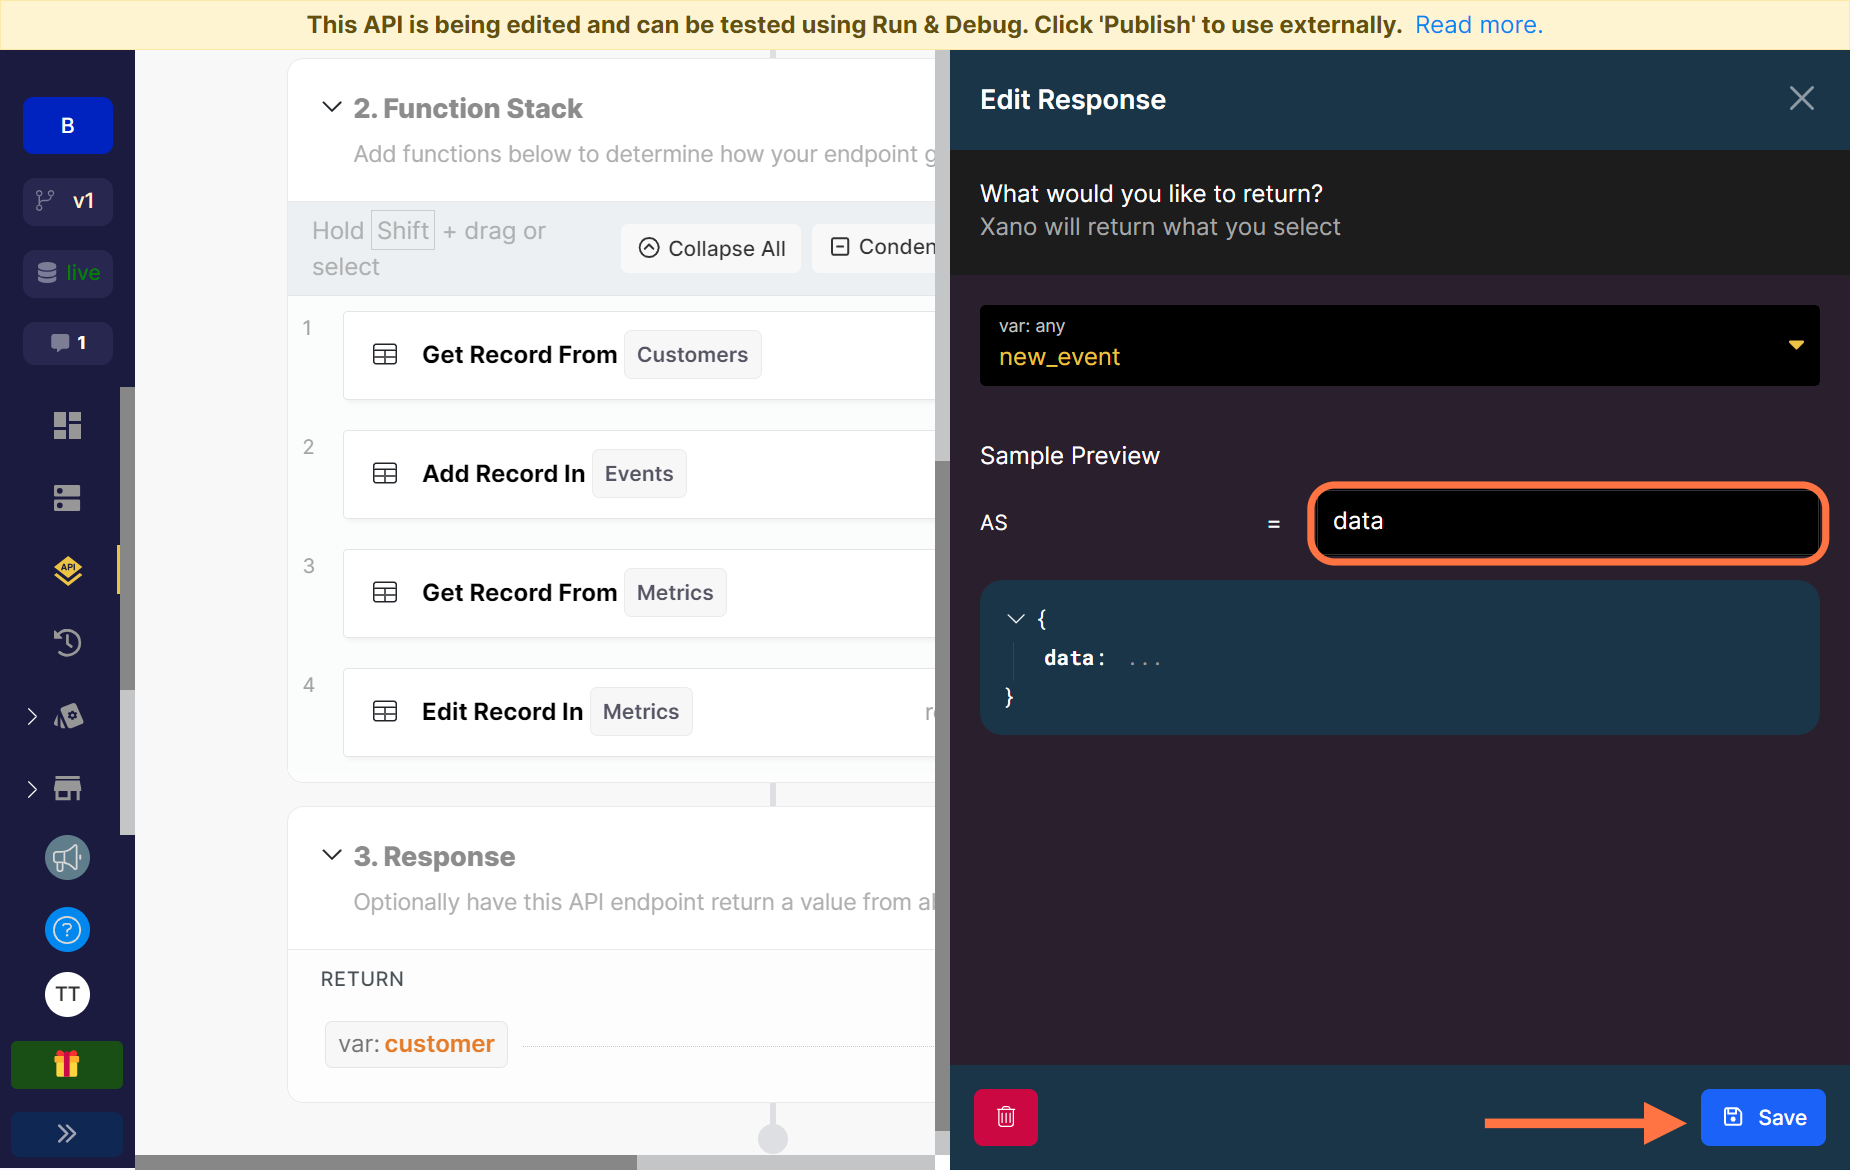
Label the response data and save.
Don’t forget to run and debug the endpoint to be sure it works well.
Authenticating the API
We are building this as a tool for internal use so you can probably decide whether you would like to authenticate it or not. You can achieve the major results either way but it would be best for security reasons.
Steps for authenticating the API with API keys are available to subscribers of my newsletter.
Next up, we’ll build out the analytics part of the tool. This is how we’ll be able to retrieve insights from our data and feed it to our graph.
Build out the analytics API
We’re finally at the last step of our build. This has been pretty long so if you got this far, yayy you! For this last step, I’m going to try as much as possible to explain as best as I can so this build isn’t even longer.
Let’s think about how this should work.
We want to analyze our data, get insights and present them in such a way that we can feed it into our graphs. For our build, we’ll focus on simple bar and line charts. Remember that we have 3 tables holding our data but the data we want to analyze and get insights from is the Events table. This is where we log every action that happens for every metric, who took that action and the value we have assigned to that action, whether cost or revenue. Here’s an example of our Events table:
| #id | created_at | metric | unique_id | value | customer_id |
|---|---|---|---|---|---|
| 1 | December 19, 2023 | support_minutes | fft567 | 20 | tami@gmail #2 |
| 2 | December 31, 2023 | processing_fees | ty678 | 300 | tami@gmail #2 |
| 3 | December 31, 2023 | support_minutes | 765rft | 12 | tami@gmail #2 |
| 4 | December 31, 2023 | support_minutes | yy65aq | 45 | jo@gmail #3 |
| 5 | January 1, 2024 | support_minutes | 89io0r | 6 | jo@gmail #3 |
Just looking at the table, an example of information you want to deduce is how much each individual customer cost you for the support_minutes metric. To get this, we’ll need to group all the support_minutes metric events by each customer and then calculate the total sum of values for each customer.
First, take out all events that are not for the support_minutes metric as well as the columns we don’t really need.
| created_at | metric | value | customer_id |
|---|---|---|---|
| December 19, 2023 | support_minutes | 20 | tami@gmail #2 |
| December 31, 2023 | support_minutes | 12 | tami@gmail #2 |
| December 31, 2023 | support_minutes | 45 | jo@gmail #3 |
| January 1, 2024 | support_minutes | 6 | jo@gmail #3 |
Now let’s rearrange the table to properly show the sum of support_minutes for each customer.
| tami@gmail #2 | jo@gmail #3 |
|---|---|
| 20 | 45 |
| 12 | 6 |
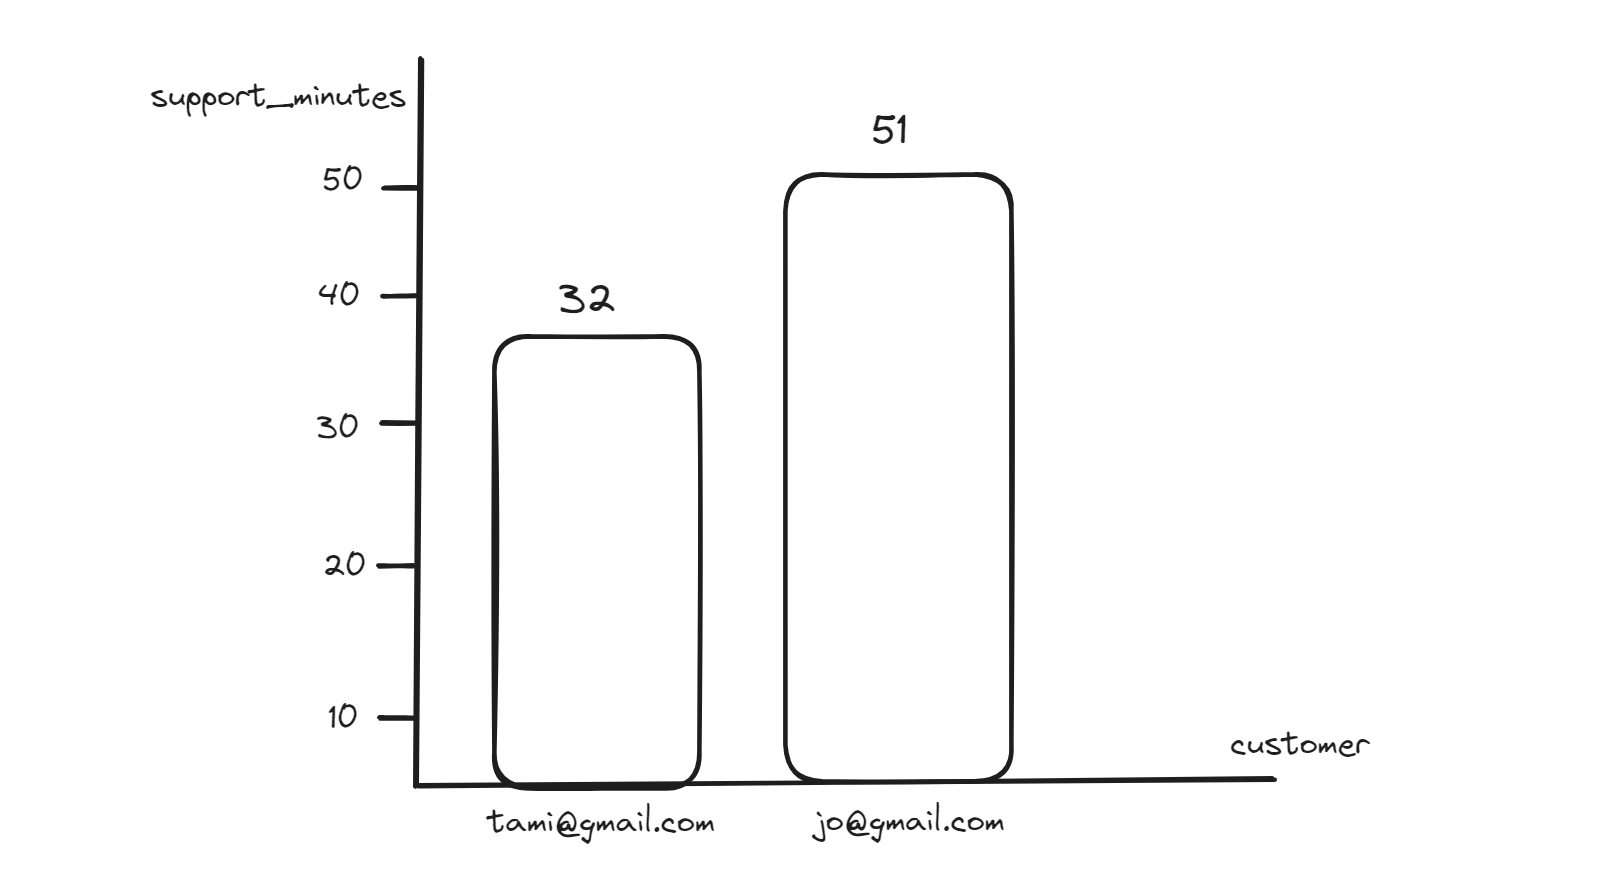
| 32 | 51 |
So between December 19th, 2023 and January 1st, 2024, customers used a total of 83 support minutes. Tami used a total of 32 support minutes and Jo used a total of 51 support minutes.
🔔 Remember that for metrics like
support_minutes, the values are not the actual cost. Here’s the explanation. The calculations for the cost are in the analytics API.
Here’s how a bar chart for this would look:
You can use this logic to build out the API.
I’ve built a public endpoint you can use to generate a bar or line chart with two different viewing options. You can group and view the data by each individual customer or you can view by each month for a particular customer. It doesn’t have to stop there, you can tweak the API so it supports more chart types like pie chart, combo bar charts and funnels. You can also modify it so you can group by whatever values you choose. Let’s take a look at the endpoint.
Inputs
start_date: This is the date you want to start querying events from. It should be written plainly like this 2023-12-18. It is a required field.end_date: This is the date you want to stop at. It should be written in the same way as the start date and is also a required field.metric_one: This is the metric that you want to analyze. Ensure that you are writing it exactly as it was when created. This is a required field.customer_email: This is the email of the customer or any other unique value that you chose when creating the customer table. The field is only needed if you want the API to generate a chart grouped by months for an individual customer.title: The title or heading for your chart or graph. This is a required field.type: The type of chart you want the API to create. The options here arebarandline.additional_operation: This is an object field that helps us calculate the actual costs for metrics like our support metrics example where we calculate the minutes the user spends and not the actual cost of the minute.
"additional_operation": {
    "value": 0
  }
Here is how the additional operation works:
Let’s again use the support_minutes metric example where Zee spends $79 each month on its support tool. In this case, the additional operation field will calculate the total sum of the minutes that all customers have spent within the time specified. It will then divide that by the value of the tool to get the cost of each minute and then multiply that by the total sum of minutes that each individual customer has spent. $79 here is the value of the additional operation.
For metrics that do not require an additional calculation, ensure that the value is always left as 0.
Group by Customer
Let’s generate a chart to see the cost of support minutes by every customer. Here’s the request:
GET https://x8ki-letl-twmt.n7.xano.io/api:U3zovbJP/analyze
{
"start_date": "2023-12-18",
"end_date": "2024-01-01",
"metric_one": "support_minutes",
"customer_email": "", // This isn't needed for grouping by customers
"additional_operation": {
"value": 79
},
"title": "Cost of Support",
"type": "bar"
}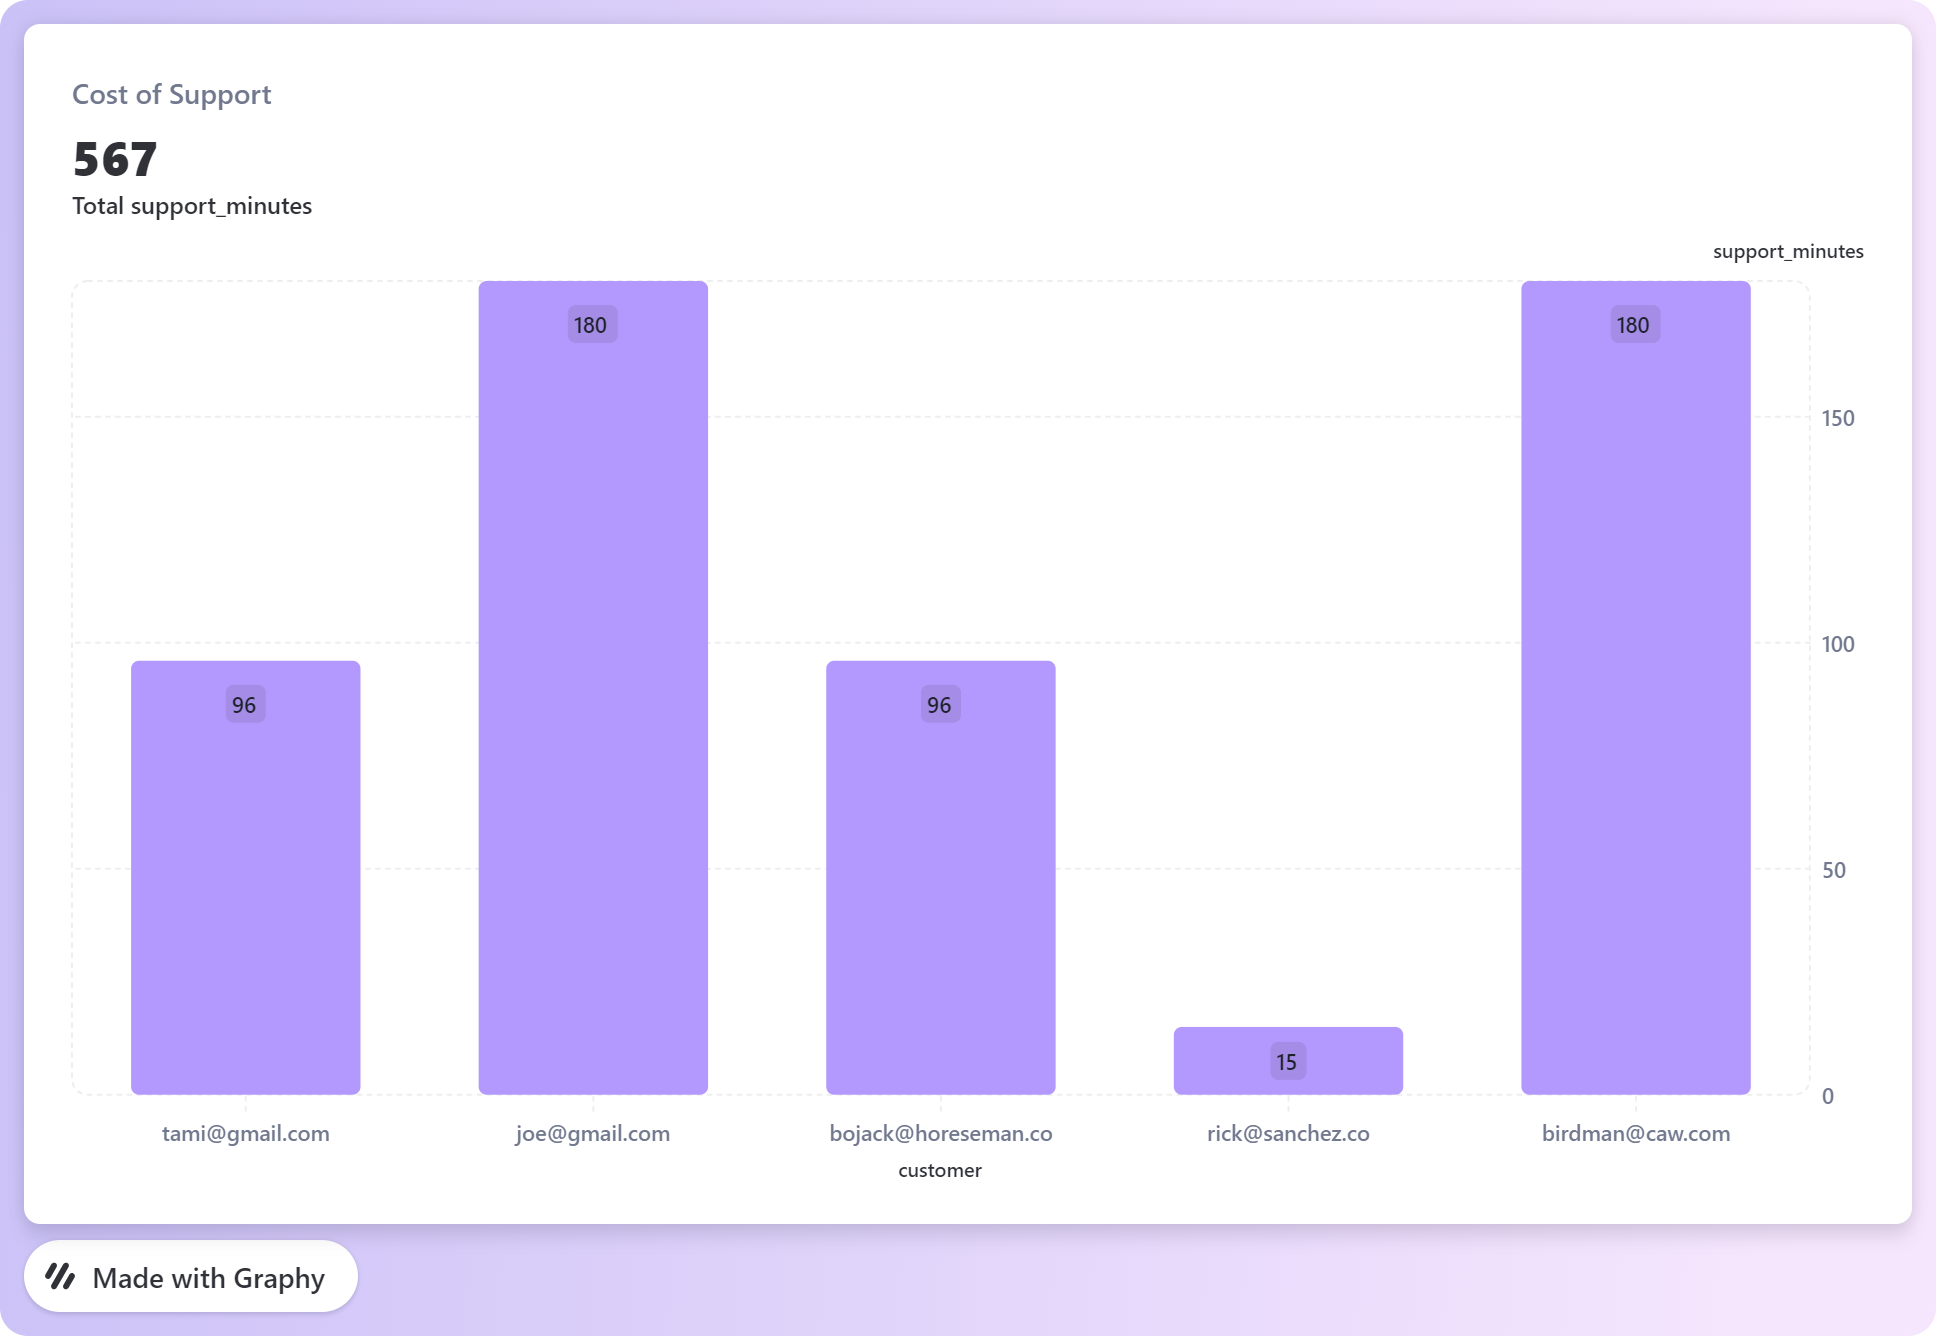 Click on the image to view the live graph
Group by Month
Now let’s do another chart to see the cost of support minutes by an individual customer grouped by month.
GET https://x8ki-letl-twmt.n7.xano.io/api:U3zovbJP/analyze
{
"start_date": "2023-12-18",
"end_date": "2024-01-01",
"metric_one": "support_minutes",
"customer_email": "joe@gmail.com",
"additional_operation": {
"value": 79
},
"title": "Cost of Support",
"type": "line"
}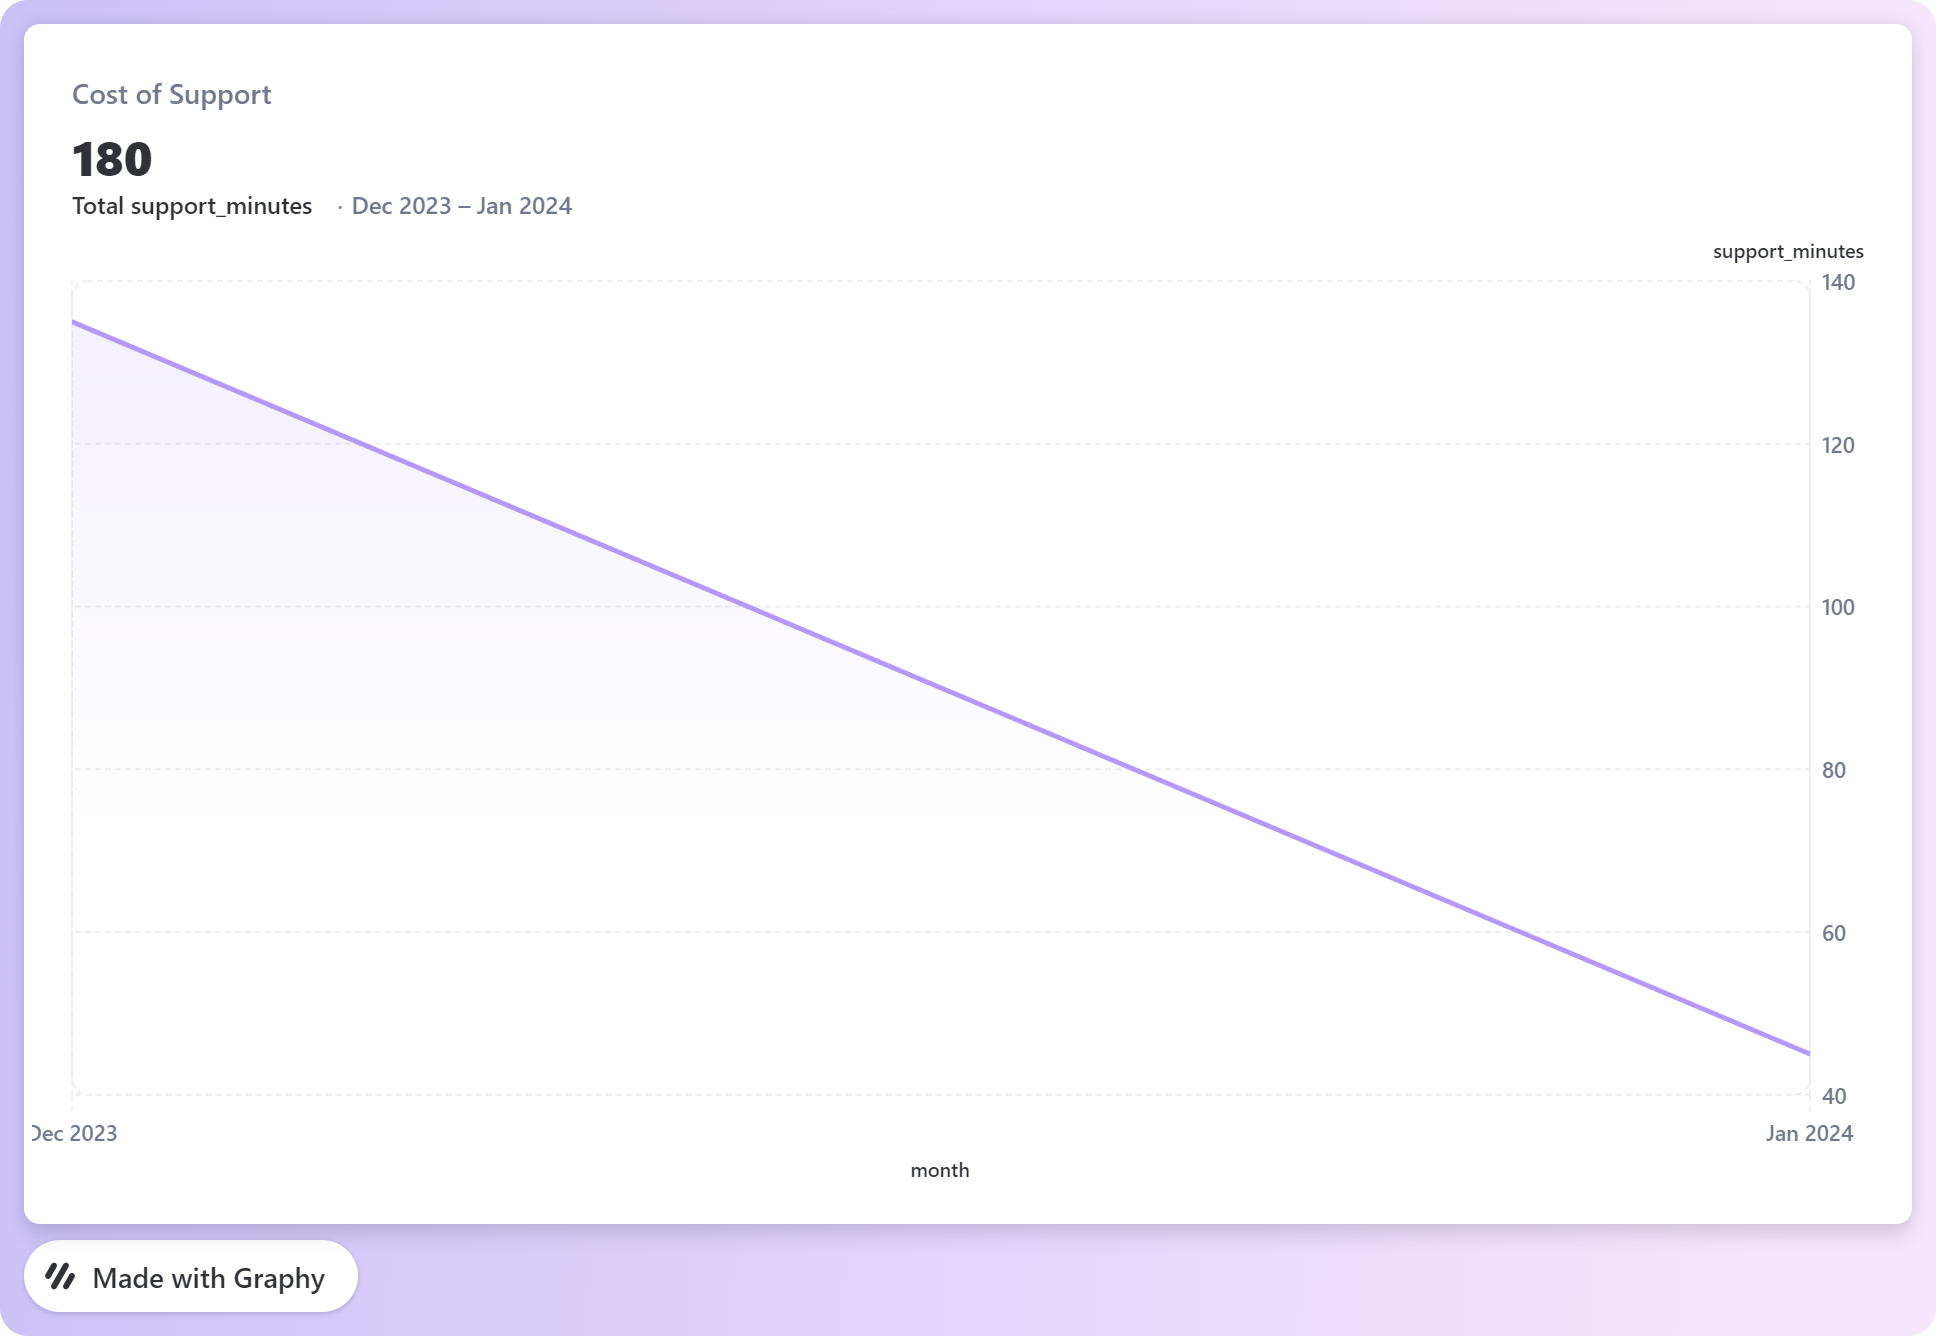 Click on the image to view the live graph
Testing, extras and notes
We’ve managed to cover all the basics that we’d need to build this tool.
- Creating customers and metrics
- Logging and storing events
- Analyzing the data
- Generating graphs
I didn’t show the full steps for the analysis and graph generation because of the length but if you’re actively building this with Xano or some other tool, I’m happy to help. I’ve made the endpoint temporarily public so you can test it and generate a graph in real time if you like.
There are a lot more steps to making this tool even better:
- Fetching and updating data for the graphs in real time
- Viewing multiple charts in groups
- More chart types - Pie, donut, combo, funnel etc.
📌 I won’t be covering them in this article but I’ll be working on building them out completely and making the full product available to try out. That may or may not include UI but you can expect an API doc.
If you like building cool stuff for work and fun, my newsletter is the place to be. Subscribe here.

0 likes